The initial weeks of 2015 have proven to be a challenging time for investors, with high volatility and negative returns plaguing the major domestic indices. However, while investors are very much on edge as we move into February, that doesn’t mean it’s time to move to the sidelines.

For traders, the stock charts are showing a wide range of opportunities on both the bull and bear side.
With that in mind, the following ideas are presented for traders to bulk up their watch lists for the month ahead. Not all of these stocks will break the way the charts indicate, of course, but this group of names is likely to deliver more than their share of beta for those inclined to make short-term plays.
Stock Charts to Watch: iShares Russell 2000 Index (ETF) (IWM)
Click to Enlarge
First up is the small-cap iShares Russell 2000 Index (ETF) (NYSEARCA:IWM), which might offer not just a trading opportunity, but also an indication of the health of the overall market.
Small-cap stocks have backed and filled for nearly a year at this point: Since the last day of February 2014, the IWM ETF is nearly flat with a return of 0.58%. Currently, the ETF is within striking range of the $120-$121.41 band that has served as resistance on four different occasions in the past year. If it can exceed this level, investors can take it as a sign that small caps may be ready to resume the ascent that characterized most of 2013.
There’s more to the story here, however, as the IWM ETF is also trading right above its 200-day moving average. This may not be particularly meaningful given that IWM’s movement around its 200-day hasn’t been a strong indicator of future performance in recent months. But now, IWM’s 200-day MA has begun to flatten out and it could be in jeopardy of turning lower if the broader market weakens. A breach of a falling 200-day would be a much more bearish signal, and it would indicate IWM could be on track to fall back toward its autumn low of $103.54.
Keep an eye on this one — IWM’s performance around these technical levels in the months ahead could serve as a meaningful barometer for overall market conditions in February.
Stock Charts to Watch: International Business Machines Corp. (IBM)

Click to Enlarge
Is International Business Machines Corp. (NYSE:IBM) a value trap or a value opportunity?
The stock is only trading at 9 times forward earnings, but the fundamentals are deteriorating and the stock charts aren’t painting a pretty picture. IBM stock already has fallen near $150 from its April high of almost $200, but the technicals are indicating there could be more downside ahead.
The longer-term chart of IBM shows comparatively little historical volume from $150 all the way down to $135, as shown by the bars on the left side of the chart below. This indicates that the stock could punch 10% lower in fairly short order, which isn’t out of the realm of reason given the negative sentiment on the name.
The bottom line: It’s safe to stay short IBM stock, and bargain hunters should wait for a final flush before jumping in.
Stock Charts to Watch: Tesla Motors Inc (TSLA)
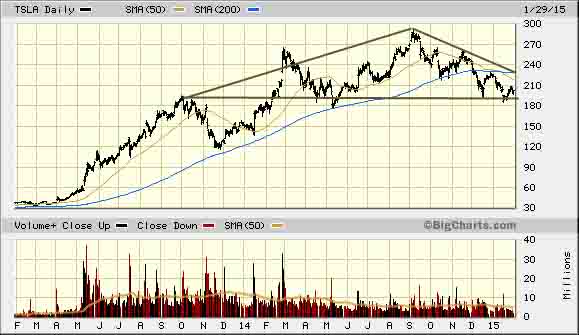
Click to Enlarge
Shares of Tesla Motors Inc (NASDAQ:TSLA) have been under the gun since early autumn, and the chart indicates that it may still not be time to buy. Analyst Dan Nathan of riskreversal.com and CNBC has popularized the concept of “the triangle of death,” which can indicate the potential for meaningful downside if support is violated.
Tesla currently is in this setup, and while there is still some distance from the stock’s current level to its support at $180, this bears watching for anyone long the stock given the potential for rapid downside to $150.
TSLA stock isn’t a short on this basis just yet, but traders should watch this triangle formation closely.
Tesla reports earnings Feb. 15.
Stock Charts to Watch: Amazon.com, Inc. (AMZN)
Click to Enlarge
For years it seemed as though Amazon.com, Inc.’s (NASDAQ:AMZN) thin margins, lack of shareholder focus and sky-high valuations would never catch up to it, but the 12-plus months haven’t been kind to the stock. Since the beginning of 2014, Amazon has shed nearly 25% of its market value.
Based on the charts, there may be more pain still to come given that Amazon stock has trended down toward the $285 level that has acted as support on four different occasions in the past 18 months. Investors need to watch this level carefully, because a breakdown will signal that the downtrend has much further to run and that Amazon truly has become a “no-touch” stock.
AMZN reports after the bell Thursday (tonight), which should provide an immediate indication of whether the support at $285 will hold.
Stock Charts to Watch: St. Jude Medical, Inc. (STJ)
Click to Enlarge
Not all of the top technical trading ideas for February are bearish. In fact, a number of stocks have printed very favorable formations in the difficult environment of the past few months.
One such stock is St. Jude Medical, Inc. (NYSE:STJ), which has been trying to break through the $70 level for over a year. At 15 times forward earnings, STJ stock has a valuation that’s reasonable enough to sustain a rally here.
However, the key recent problem for the stock has been the strength of the dollar. As a result, any relief rally in foreign currencies — a strong possibility given the extremely negative sentiment surrounding the euro — could be the catalyst for a breakout in St. Jude.
Stock Charts to Watch: Toyota Motor Corp (ADR) (TM)
Click to Enlarge
The chart of Toyota Motor Corp (ADR) (NYSE:TM) speaks for itself.
TM stock is sitting right at its highs of mid-2013, and is just a few cents shy of its high-water mark of $131.98. While Toyota shares have doubled in the past three-plus years, the stock’s 11.2 forward price-to-earnings ratio leaves plenty of room for additional upside.
Toyota is expected to report earnings on Tuesday, Feb. 3.
Stock Charts to Watch: Auto-Related Stocks

Click to Enlarge Toyota is just one of many strong charts in the auto-related group. Retailers and parts suppliers are also home to a number of compelling formations that indicate a strong possibility for new highs. Among these:
Autoliv Inc. (NYSE:ALV), which supplies safety systems (think airbags, seatbelts and child seats, among other things).
AutoNation, Inc. (NYSE:AN), the national automotive retailer that sells a swath of brands, from General Motors Company (NYSE:GM) to Toyota to Volkswagen AG (ADR) (OTCMKTS:VLKAY).
Penske Automotive Group, Inc. (NYSE:PAG), which most people know for its vehicle service and repair shops, but also sells new and used cars.
Stock Charts to Watch: Amdocs Limited (DOX)
Click to Enlarge
Finally, Amdocs Limited (NASDAQ:DOX) may be a lesser-known stock, but the chart shows some outstanding potential. With more than seven months of resistance built up and five hits in the $49 range, DOX stock is poised for a meaningful move higher if a breakout occurs.
The stock also has a forward P/E of 13.1, which supports a breakout from current levels.
While these 10 stocks make for compelling trading ideas for February, there are plenty of other names that warrant investigation. Traders who are in the market for ideas should also take a look at:
United Technologies Corporation (NYSE:UTX)
Expeditors International of Washington (NASDAQ:EXPD)
Johnson Controls Inc (NYSE:JCI)
Ametek, Inc. (NYSE:AME)
Molson Coors Brewing Company (NYSE:TAP)
Under Armour Inc (NYSE:UA)
As of this writing, Daniel Putnam did not hold a position in any of the aforementioned securities.