You know the story of the recent extremely sharp v-shaped reversal in U.S. stock as represented by the SPDR S&P 500 ETF (NYSEARCA:SPY). The rally now measures 19% in about eight weeks … and counting. By many measures, this rally is now historic in terms of its steepness and signs point to buyer exhaustion in the near term.

I often discuss in this here column the fact that stocks as an asset class are highly correlated, particularly in times of heightened volatility … as well as in cases such as the recent v-shaped reversal. One simple tactical trick I like to apply when the broad stock market makes an outsized move in either direction is to start legging into opposite positions (shorting upon a sharp rally and vice versa), using the S&P 500, i.e. the SPY ETF. I like to dip a toe in the water using a broad ETF as opposed to single-name stocks so as to cut out the idiosyncratic risk. Ultimately if the market then does reverse I will look for single name stocks to play or sector/group ETFs.
To wit, after this most recent 19% rally in the SPY, I am now looking to do the same thing … start legging into a short position using the SPY ETF as opposed to a single name stock.
As always, before digging into the exact trading setup we must first build some perspective and we do that using a long-term chart, in this case the monthly increments chart stretching back to the late 1990s.
SPY ETF Charts
Click to Enlarge
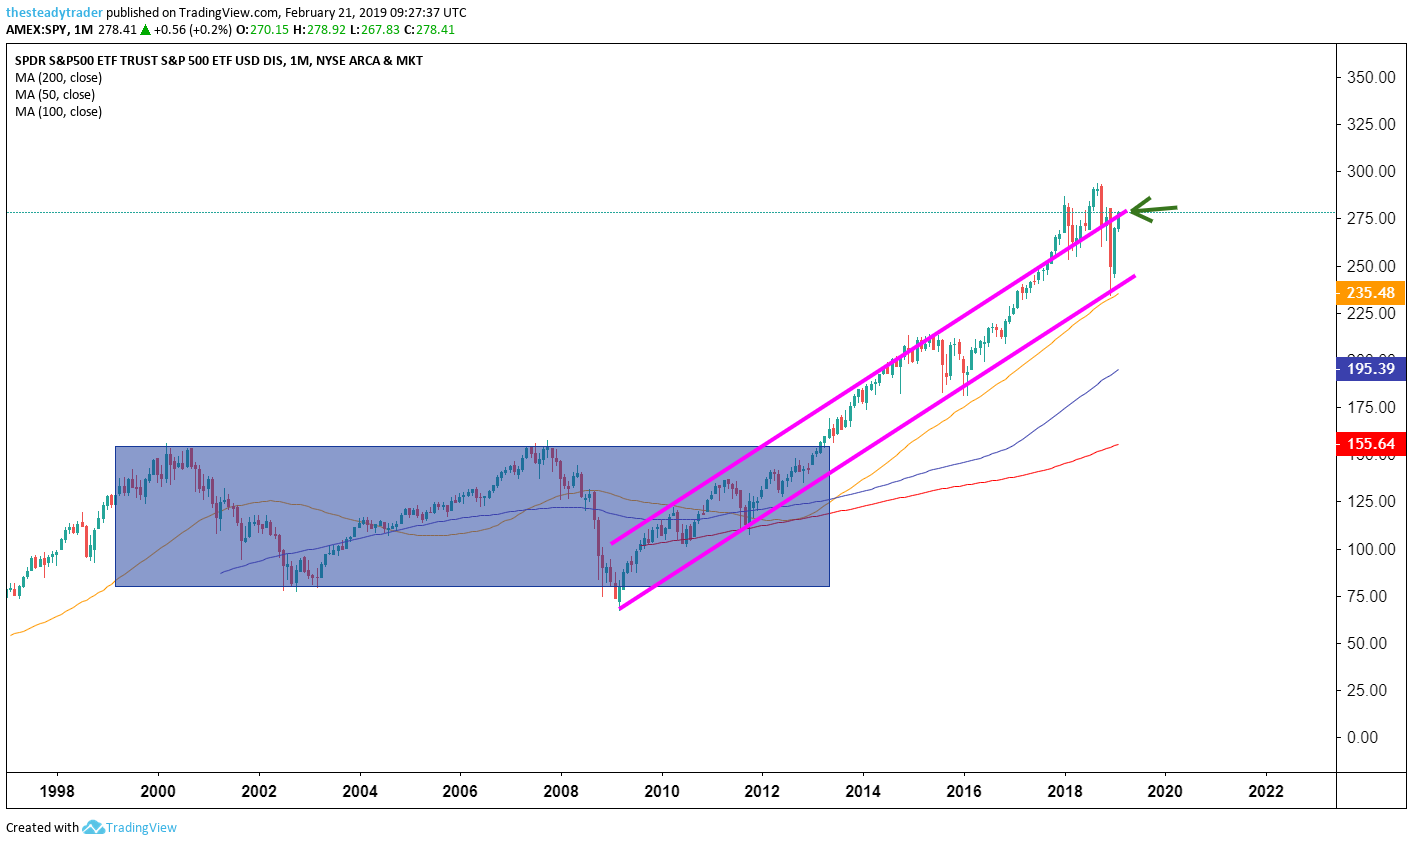
Moving averages legend: red – 200 week, blue – 100 week, yellow – 50 week
On this chart, we see that in 2013 the S&P 500 finally broke out of its secular bear market (blue box). The rally that started in 2009 for the most part took place in a well-defined up-trending channel, until we saw an overshooting move in 2017 and first part 2018. The mean-reversion move lower we then saw in Q4 2018 through this lens was simply a reaction to the extreme overbought readings in previous quarters.
Considering that global growth has been slowing since Q1 2018 (and now U.S. growth is following suit), corporate earnings face stiff year over year comparisons and the charts saw serious damage in Q4 2018, it is in my eye difficult to see any sustainable new highs in the S&P 500 anytime soon.

Click to Enlarge
Moving averages legend: red – 200 day, blue – 100 day, yellow – 50 day
On the daily chart, we see the ridiculously sharp v-shaped reversal from the previous couple of months … this is not something you see often, at least not in this magnitude.
Note that the SPY ETF, while having blasted above its intermediate-term moving averages (not unusual during v-shaped reversals or dare I say ‘bear market rallies’), is now just about reaching the $280 area. Note that this area acted as resistance three times in Q4 2018 until finally leading to a big second leg lower in December.
From a momentum perspective we see that the daily MACD oscillator at the bottom of the chart is now nearly as overbought as it was in January 2018. And so you know, January 2018 was an all time record overbought reading.
Less risk-averse traders and active investors could now look to leg into an initial short side trade in the SPY ETF around the $278-$280 area. A first downside profit target is $268 and a stop loss is a break above $282.
Get FREE ACCESS to Serge’s renowned Stock Market Scanner with actionable trade ideas. Get it HERE.