Big gains from elite tech last Friday … what history suggests about how much longer tech will be weak … Luke Lango’s gameplan for today
Friday showed us just how explosive the gains can be when the bulls get back in charge.
The S&P climbed 2.4%, but the real fireworks were in the Nasdaq, which erupted 3.8%.
But what’s wild is that 3.8% doesn’t even begin to describe the action from a handful of top-tier technology stocks.
After market-close on Friday, I browsed the Early Stage Investor portfolio from our hypergrowth expert Luke Lango.
As measured from either last Wednesday or Thursday extending through end-of-day on Friday, I saw gains of 17%… 19%… 21%… 24%… 25%… 27%… 29%… 41%…
There were likely other stocks in the portfolio with similar returns but I stopped running the numbers – you get the point.
Plus, as I write Monday morning, though the Nasdaq is down about 1%, some of Luke’s stocks are continuing to climb. I’m looking at 5% up, 7% up, even 10% up.
To be fair, these gains come after months of heavy selling pressure, so we’re not boasting about the specific gains. The more relevant issue is what do these gains mean?
***Has tech reached an inflection point, and the massive “divergence snap back” that Luke has predicted has started?
Let’s go straight to Luke for his answer:
Perhaps. But let’s not be so quick to call it that.
We’ve been fooled by bear market bounces before. Let’s not be fooled again.
The reality is that Treasury yields do look like they’ve peaked, but inflation is still red-hot, and the Fed is still super hawkish.
Remember: We need all three of those factors to turn into tailwinds before the markets start to stabilize.
To be sure, history and our analysis strongly suggest that our stocks will rebound well before the rest of the market stabilizes, so our stocks will rebound in advance of inflation meaningfully cooling and the Fed turning dovish.
However, this still feels a bit “too soon.”
As Luke pointed out, the last few days have seen easing on the 10-year Treasury yield. We’re back below 3%, which is important psychologically. As I write, it’s at 2.86%.
On the inflation front, last week’s Consumer Price Index and Producer Price Index reports both marked a small slowdown in inflation.
It’s far too early to claim any sort of victory, but every reversal has to start somewhere. Next month’s readings will give us more context.
As to the Fed: As we’ve pointed out here in the Digest, Fed members seem to be full of big talk but little action. This underscores the point Luke has made repeatedly, which is that this current Fed is intrinsically dovish.
Behind the tough talk, they want to be accommodative. Given this, if we see inflation begin to come down organically, the Fed will leap at the chance to let off the gas.
And when all three of those variables converge, that’s when Luke sees hypergrowth tech leaders staging an enormous rally.
***Factoring all of this in, where are tech stocks today in the context of a bust/boom cycle?
Back to Luke:
We do increasingly think we’re watching a repeat of the dot-com crash.
If so, that’s actually bullish, because as we’ve shown you previously, the growthiest stocks in the market have collapsed to levels consistent with where this group bottomed in the dot-com crash – in terms of time, percent decline, and valuation multiples.
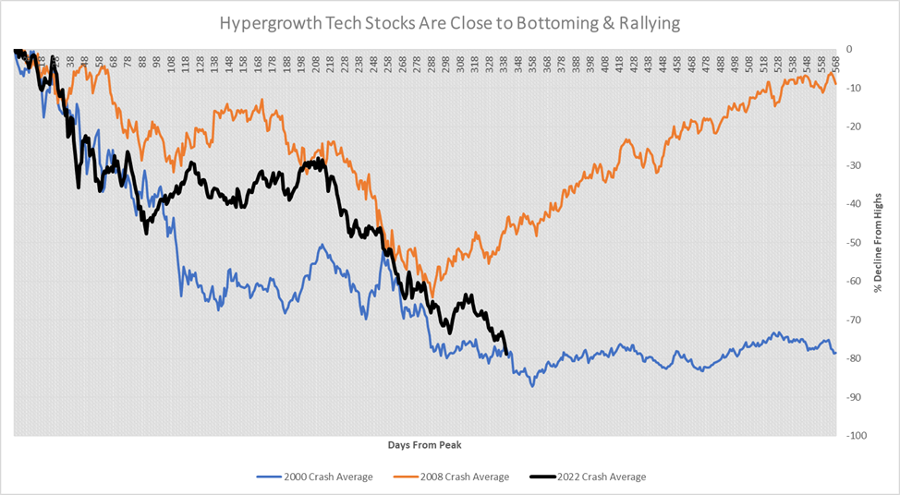
To illustrate this point, Luke provides the chart below.
What you’re seeing on the X-axis is the number of number of days since the high of the dot-com crash (in blue), the Great Financial Crisis crash (in orange), and our current tech crash (in black).
The Y-axis shows the percentage decline in the market from the prior peak.
This chart echoes the Nasdaq statistics we brought you last week courtesy of Louis Navellier:
Our friends at Bespoke showed that when NASDAQ Composite has a 25%+ drawdown like it did between November 19th thru May 9th, the eight previous times this has happened, the NASDAQ Composite has then risen an average of 1.9% (1 month), 11% (3 months), 20.4% (6 months) and 33.5% (1 year).
Also interesting is that the average duration of a 25%+ drawdown was 161 days.
Since the current duration of the 27.6% drawdown between November 19th thru May 9th is 171 days, the current NASDAQ Composite correction is getting a bit old by historical standards.
***So, how will we know if we’ve actually bottomed or this is just a bear-market rally?
Obviously, no one has a crystal ball, but let’s look at the Nasdaq’s chart to put a few levels on your radar.
First, note that the Nasdaq just bounced off its recent five-month support line. I’ve added that below.

The immediate bullish level to watch is the support level that broke earlier this month of about 12,500.
As you can see below, this is the level at which the Nasdaq bounced in March, held briefly in late April/early May, but then gave up.
As I write, the Nasdaq is roughly 7% below this level.
If tech can regain and hold it, it will be an important sign of strength suggesting the beginnings of a sustained tech rally.
But if it doesn’t hold, continue to hold tight and focus on what’s eventually coming. Use the examples we provided at the top of this Digest of double-digit gains over just two or three trading sessions as evidence of how quickly elite growth stocks can rally when sentiment turns.
Here’s Luke’s gameplan:
We believe history is entirely repeating itself today, meaning that the best thing we can do for our portfolios at the current moment is to consolidate those portfolios around the stocks that we have the highest conviction can soar like Amazon, Apple, eBay, and F5 soared in the aftermath of the dot-com crash.
With all that said, we will be monitoring the recent bounce in hypergrowth stocks against the backdrop of the still reeling stock market.
If this trend persists, that will be a meaningfully bullish signal that the turning point for our portfolios has arrived. If it doesn’t, we will continue to monitor for other signals on the idea that we’re either at or very close to that critical turning point.
One last point before we wrap up.
***If you’re a tech investor, you’re likely sitting on some substantial losses
I’m willing to bet that a handful of those losses are severe.
Now, the math behind the gains required to breakeven on a bad loss can be intimidating.
For example, if you go down 50% on an investment, you need a 100% gain simply to break even. If you lose 95%, you need a 1,900% gain to get square.
In light of this, you might be wondering about the likelihood of your underwater tech plays turning into winners.
Well, let me show you the chart we ran in the Digest last week.
It shows the gains from certain technology stocks as measured from their lows of the Great Financial Crisis through their peak price in subsequent years.
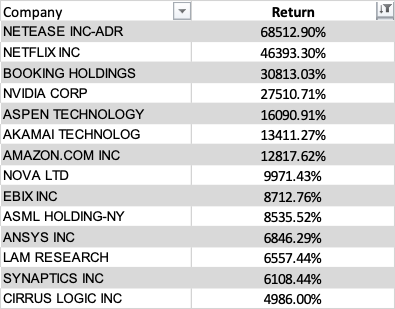
I hope you’re seeing the takeaway…
Yes, when you’re invested in top-tier technology stocks that are growing their top- and bottom-line numbers like crazy, you can make back enormous losses and then some.
Now, this isn’t a license to ignore your stop-losses going forward. But it’s a reason for optimism if you’re sitting on great stocks that are deep underwater today.
This has been a brutal stretch for tech investors, but history shows that this, too, shall pass. And when it does, the best hypergrowth stocks are going to make up for their losses and far more.
Here’s Luke with the final word:
This is 2001 all over again, folks.
Don’t you wish you bought Amazon stock at $5 in 2001? You essentially have that opportunity again in 2022.
We aren’t saying the selloff is over. But we are saying that we’re awfully close to a bottom. And when the big turnaround does arrive, days like [last Friday] won’t be the exception. They’ll be the norm.
Have a good evening,
Jeff Remsburg