A technical analysis of the S&P … keep your eyes on the strengthening dollar … short-term bullish technical indicators versus September’s bad history … is the bull case fully priced-in?
Since hitting a 52-week high at the end of July, the S&P has been falling.
As I write Monday morning, we’re down roughly 3.5% in August. Meanwhile, the Nasdaq is down almost 5% and the Dow is off nearly 3%.
Let’s zero in on the S&P…
As you can see below, this August slump has dragged the S&P down below its 50-day moving average (MA).
To make sure we’re all on the same page, a moving average is a line on a chart showing the average of some stated number of prior days’ worth of asset prices. Moving averages provide investors and traders helpful perspective on market momentum.
The S&P trading below its 50-day MA reflects short-term momentum having turned bearish.

Is this a warning sign that a deeper correction is brewing?
Well, it’s certainly not good news, but it’s hardly a death knell for bullishness.
Let’s look again at the S&P and its 50-day MA over a one-year timeframe.
I’ve circled the two other times after last October’s bottom when the S&P dipped below its 50-day MA, yet clearly the bullishness wasn’t over.
But let me draw your attention to one big difference between then and now.
How will the strengthening U.S. dollar impact stocks this time around?
As we’ve detailed in prior Digests, in general, stocks don’t like a strong dollar because it creates a major currency conversion headwind for companies that do international business. All those overseas sales revenues and profits paid in foreign currencies aren’t worth as much when converted back into strong U.S dollars.
Roughly 40% of the S&P’s revenues are generated outside U.S. borders. For the tech sector, nearly 60% of its revenues are foreign.
To illustrate how big of a deal this is to stock prices, below, we look at the U.S. Dollar Index relative to the S&P over the last two years.
You’re going to see the obvious inverse correlation. As the dollar strengthens (in green), the S&P falls (in black), and vice versa.
With this context, let’s look again at the S&P and its two prior pullbacks beneath its 50-day MA. We’re going to zero in on those two occasions.
The chart below is busy, so let me tell you what to look for…
Both times the S&P rallied after bottoming below its 50-day MA (circled in blue), its efforts to find support were aided by a dollar that had turned weaker in the days before the S&P bottomed.
Back in December several weeks of a softer dollar preceded the turn in stocks. In March, it was only one week. But both times, a softening dollar fueled the S&P’s rally back above its 50-day MA.
Also, note how both times, the dollar continued to fall, providing a tailwind for the S&P’s rally.
What’s different about this most recent loss of the 50-day MA is that the dollar is surging and showing little signs of slowing down
Below is the longer-term chart that brings us up to present day.
I’ve marked the recent upward trajectory of the dollar in red because it’s bad for stocks.
If you want. to know where this market is going, the simplest thing to do is watch the dollar. And right now, it’s showing considerable strength.
Beyond the dollar, we’re going to see a battle of crosscurrents in September
The market faces two conflicting pressures…
On one hand, there are short-term technical indicators suggesting the selling pressure is becoming overextended and we’re due for a rally. We might have seen one begin last Friday, which could be continuing as I write Monday morning.
Last week in the Digest
, we highlighted some of the bullish short-term technicals that our hypergrowth expert Luke Lango is watching. Here’s a recap from Luke from his Innovation Investor Daily Notes:
– The Relative Strength Index has crashed to below 35, where it bottomed in the March and December sell-offs.
– The McClellan Oscillator has dropped to -55, where it bottomed in the March and December sell-offs.
– The Stochastic Oscillator has dropped below 5, where it bottomed during the March and December sell-offs.
– The market has broken below its lower Bollinger Band, something it also did near the bottoms of the March and December sell-offs.
Imagine a rubber band, stretched farther and farther toward the limits of its elasticity. At some point, the pressure to “snap back” becomes overwhelming.
In the same way, the indicators Luke highlights suggest the S&P is similarly stretched to the downside. This increases the probability of a mean reversion rally.
But standing in the way of such a rally is September – historically, the worst month of the year for the stock market
From Barron’s:
…History doesn’t offer much hope in terms of near-term relief, given the dreaded September Effect.
According to data compiled by Dow Jones, September is easily the worst month in terms of average monthly performance for all three major indexes: In September, the Dow falls an average of 1.08%, the S&P 500 slips 1.12%, and the Nasdaq slides 0.85%, dating back to 1896, 1928, and 1971, respectively.
The competition isn’t even close with the other worst months—February, August, and May, which offer much less-discouraging performances; October, for all its fearsome reputation, tends to see all three indexes rise.
Moreover, September is the only month of the year that the Nasdaq has historically notched a monthly loss—a concern given how tech-heavy this year’s rally has been.
Barron’s also cites research from ETF.com’s resident quant researcher Rob Isbitts who points out that today’s market shares similarities with past summer/autumn periods that have been tough for stocks:
From a technical analysis standpoint, today’s S&P 500 exhibits a similar pattern to not one, but three August-September wrecks of the past: 1987, 2000 and 2022.
The big question today is “what’s the fuel that will continue to push the market higher in September?”
The bearish argument is that the market already priced in a “best case” scenario for the S&P with its 20% return through the end of July. And now, with the Fed not as dovish as a best-case scenario would suggest, stocks need a new source of bullishness.
The biggest illustration of this comes from last Wednesday’s earnings report from Nvidia. It was nothing short of a monster display of strength and profitability. And yet after surging roughly 10% pre-market, it closed last Friday at a loss based on its price before its earnings pop.
Below, you can see the excitement on the day of the earnings report (before Nvidia announced after market close on Wednesday) … the explosion of buying pressure after hours… then the ensuing weakness through today as I write.
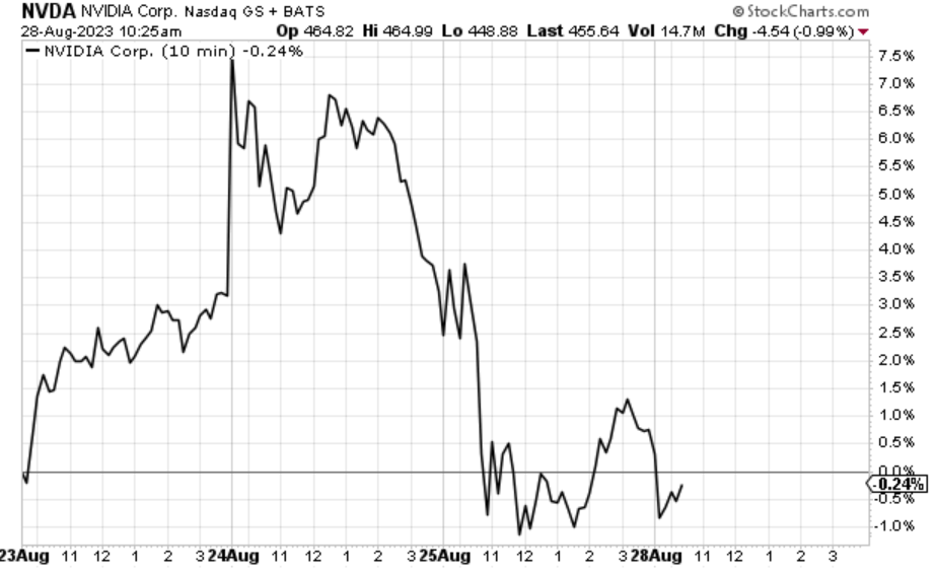
By itself, this could be explained away as “buy the rumor, sell the news,” but other AI stocks and the broad market didn’t enjoy any tailwinds from the fantastic earnings report. That hints at the bearish argument from a moment ago – the good news (for the moment) is priced-in.
Now, fresh good news can come later this fall in the form of earnings… or a surprisingly dovish Fed… or bullish seasonality that kicks in for November and December…
But September is next.
It’ll be fascinating to watch the bull/bear tug-of-war over the next six weeks based on the influences we’ve highlighted today. I can’t predict which way the market will move, but I think it’s safe to predict we’re in for some exaggerated volatility.
We’ll keep you updated.
Have a good evening,
Jeff Remsburg