Energy giant and Dow Jones Industrial Average constituent Chevron Corporation (NYSE:CVX) reports earnings Friday morning. In the days leading up to the event, traders and investors alike are both asking themselves whether Chevron will trump fourth-quarter earnings expectations, or whether the corporate confessional will cause a spill in CVX stock.

Let’s take a look at recent announcements for Chevron, analyze the CVX stock chart and determine what (if anything) the options market is suggesting will come Friday.
Then, we’ll set up a trade to help you capture profits from the announcement.
Chevron Earnings Picture and Analyst Sentiment
Ahead of Chevron’s Friday morning Q4 earnings release, analysts are forecasting profits of 66 cents per share. Actual estimates encompass a very wide range from 35 cents to $1.15.
The mean Street expectation implies a whopping 154% earnings growth year-over-year, as Chevron reported a mere 26 cents in profit in 2016. That result came up short of views by more than 50%. We’re not holding our breath, but if Wall Street is on the money this time, the 66-cent profit would represent a sequential decline of 8.3% from Q3, which surprised by 31.5% to the upside.
Revenues are estimated to grow by 26% to $36.7 billion compared to 2015’s sales of $29.2 billion. Here too, range views are volatile, with a low forecast of $27.2 billion compared to a Street high of $62 billion. Sequentially, CVX’s revenues are forecast to jump by 22%.
The Wall Street community is split on Chevron stock. Eighteen rate the stock a buy, while 10 maintain hold ratings. Price targets on CVX range from a low of $95 to $145 with a median estimate of $125.50 over the year.
CVX Stock Short-Term Trading Record
If it isn’t obvious yet, Chevron has established a mixed record compared to actual Street profit views. Over the past couple years, CVX has beaten forecasts 58% of the time, while missing 42%.
Investor reaction has proven a bit more consistent, with gains in four of the past six announcements immediately following earnings.
Working backwards, CVX stock has moved 3.91%, 0.68%, -0.21%, 0.63%, 1.10% and -4.89% on a close-to-close basis. The net reaction in Chevron has produced an average gain of 0.2% in the first full session of trading. Variability of 2.86% based on a one standard deviation reading yields an estimated range of -2.66% to 3.06%.
In other words, Chevron doesn’t often move that much.
CVX’s seven-day performance has also allowed for a fairly benign average result, with shares falling marginally by 0.23%. However, the longer period has been accompanied by a much larger standard deviation of 5.14% and bumpier forecast range of -5.37% to 4.91%.
CVX Stock Weekly Chart
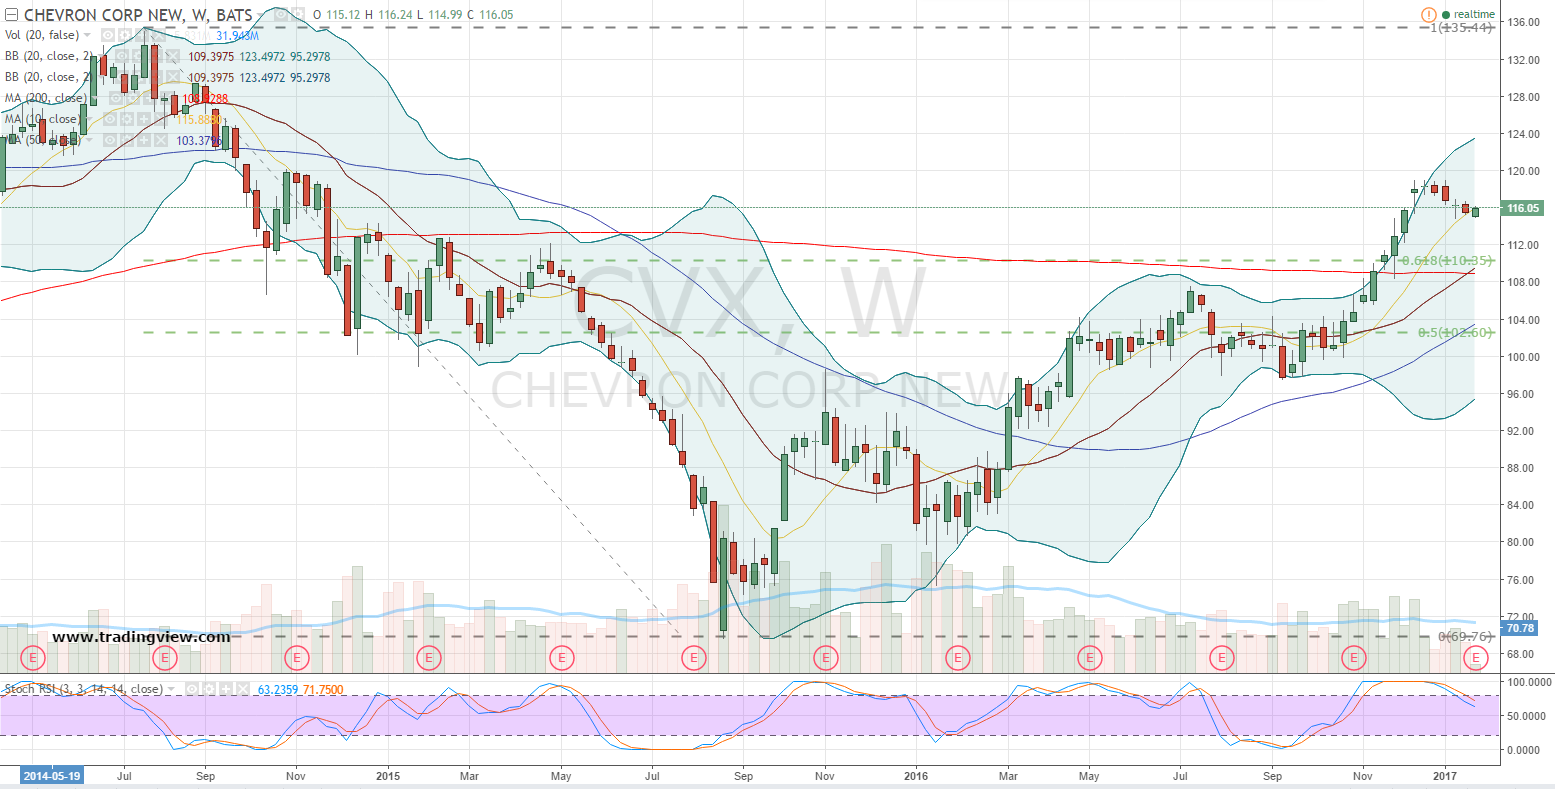
Click to Enlarge
Currently, CVX stock is in the process of establishing a minor counter-move of several weeks. The overall shape of the pattern resembles a bullish weekly cup-and-handle.
With the handle or pullback situated above the 62% retracement level and longer-term weekly moving averages, bullish traders are provided plenty of technical support. That said, these supports comprise a fairly wide price range in CVX stock.
Testing of the penetrated 50% level and 50-week simple moving average near $102.50-$104 is roughly 10% to 11% below the current share price in CVX. Such a price drop wouldn’t invalidate the uptrend, but the allowance for the current handle would certainly be compromised.
How to Trade CVX Stock
The spread between implied and underlying volatility in CVX has widened over the past month. Not only is 30-day implied volatility mostly flat, but it continues to trade in a very narrow price band — from about 15% to just above 20% over the past few months.
At the same time, statistical volatility of CVX stock has fallen to around 12% and fresh two-year lows.
The at-the-money 27 Jan $116 straddle market points to a 68% chance BAC will remain within an approximate price range of $113.40 to $118.60 into Friday’s expiration. The math behind the calculated range is based on implied volatility of 25%, three trading sessions and shares of Chevron at $116.
The purest play on the earnings event is the weekly contract. Even during quiet periods like the one CVX stock is witnessing now, those premiums reflect what traders collectively expect to happen in the stock in the immediate aftermath of earnings.
The dollar move up or down works out to wiggle room of about 2.26% by Friday’s close — a fairly quiet and typical event.
Investment accounts under Christopher Tyler’s management do not currently own positions in any of the securities or their derivatives mentioned in this article. The information offered is based upon Christopher Tyler’s observations and strictly intended for educational purposes only; the use of which is the responsibility of the individual. For additional market insights and related musings, follow Chris on Twitter @Options_CAT.