Baidu Inc (ADR) (NASDAQ:BIDU) shares are exploding higher this morning after smashing expectations in its latest earnings report. BIDU stock is up 8%, notching a new 52-week high. The surge is creating one heck of a breakout on its price chart.

Indeed, the price pattern that just completed belongs in a textbook.
A quick look at the results first. Baidu reported 143% growth in earnings to $2.36 per share, on the back of revenues that grew 14% to $3.08 billion. While the top line was merely a match of Wall Street expectations, the bottom line cruised past estimates for $1.51 per share. The midpoint of Q3 guidance for $3.41 billion-$3.5 billion also came in ahead of the consensus mark of $3.43 billion.
Also promising was strength in mobile, whose revenues jumped from 62% of total sales a year ago to 72% this quarter.
Jefferies’ Karen Chan reiterated their “Buy” rating in response, and gave BIDU stock a hefty new price target of $232 per share — another 15% upside from Thursday’s closing price.
That brings us to today, and to the charts.
Baidu’s Charts
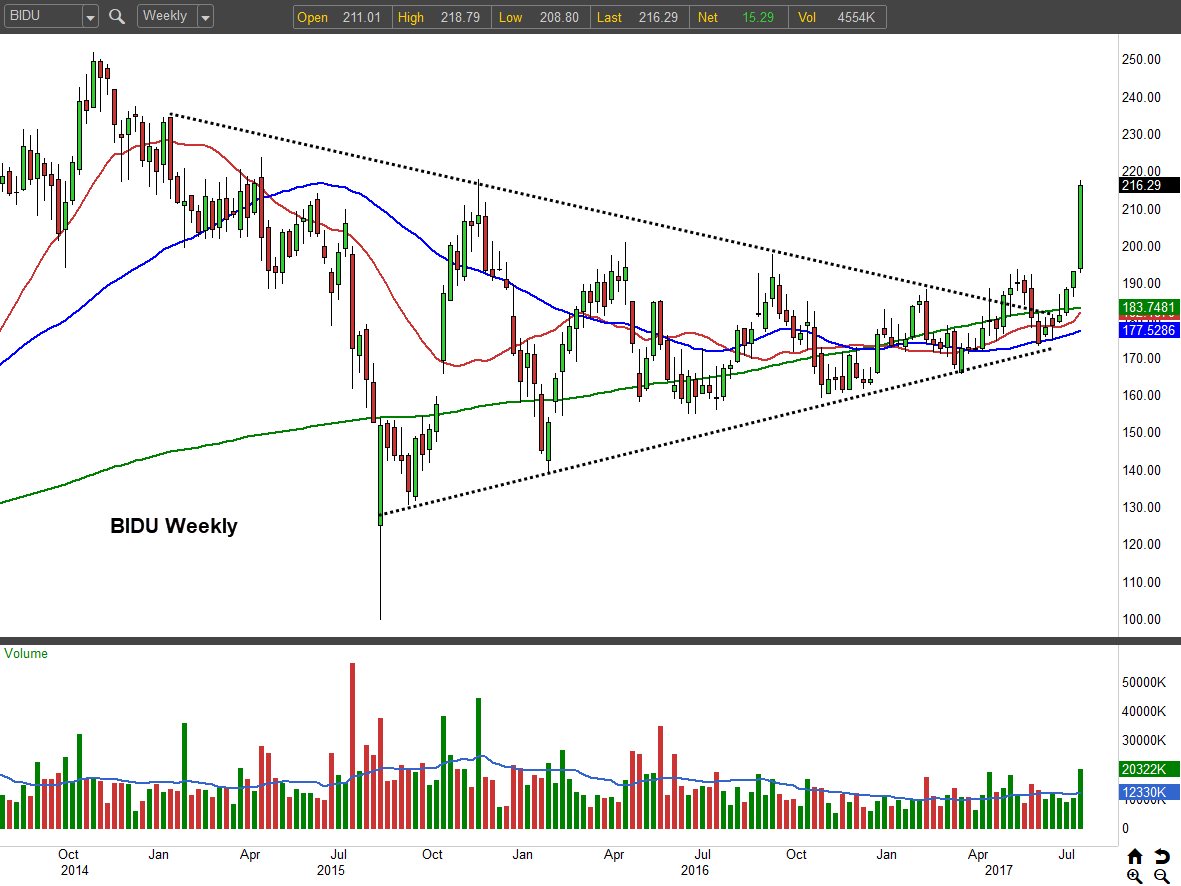
For the past year, Baidu shares have been compressing into an ever-tightening range. Buyers have been getting more aggressive, but so too have sellers. That’s the underlying dynamic that has created the symmetrical triangle pattern shown so clearly in the accompanying weekly chart.
Bulls and bears have been on a collision course for months now. When prices approach the apex of the triangle, a breakout is inevitable. All BIDU stock needed was a catalyst, an event to finally make one side finally commit. And it just arrived in the form of a stellar earnings report.
Click to Enlarge
The magnitude of Baidu’s ascent has driven it well into overbought territory. The Relative Strength Index (RSI) reading of 85 is the highest we’ve seen since 2013. Incidentally, that particular episode was created by a large earnings gap as well. As exciting as this morning’s surge is, prudence dictates waiting for a retracement if you’re a stickler on low-risk entries.

Click to Enlarge
If I were to chase here, I’d use bull put spreads to give myself a wide profit range to withstand a pullback in the stock. Let’s take a look at which strikes make sense.
How to Trade BIDU Stock
If you’re willing to bet Baidu remains above $200 for the next six weeks, sell the Sep $200/$195 bull put spread for 90 cents or better. There is plenty of old resistance in the $200 zone, so I fully expect that level to provide support if it is ever retested in the weeks ahead.
Your max reward is limited to the initial 90 cents premium. You will capture the coin if the put spread rests out-of-the-money at expiration. The max risk (and cost) is $4.10 and will be forfeited if BIDU completely reverses its breakout and falls to $195 by expiration.
As of this writing, Tyler Craig did not hold a position in any of the aforementioned securities. Want to learn how to master the art of option selling for high-probability cash flow? Check out Tyler’s recently released video series through Tackle Trading on how to systematically sell iron condors for monthly income.