U.S. government bonds and notes — treasuries — have had a great run year-to-date. The longer-end of the so-called bond curve is represented by the iShares 20+ Treasury Bond ETF (NASDAQ:TLT), and for the year, this exchange-traded fund is higher by around 17%. While I personally think this bond rally can continue in coming quarters, in the near-term, the rally looks to be vastly overdone and a mean-reversion trade looks to be setting up for active investors and traders to feast on. Here’s how you should approach the TLT ETF today.

When speaking to retail traders I often get the sense that they are not just confused but also scared by the bond market, and thus avoid following it, much less trade it. In reality, the bond market is not only a key driver of the stock market but it also dwarfs the stock market in size.
Interest rates are key to any financial model and the backbone to financing activities not just for banks but also for corporations and governments around the globe. In other words, to ignore this market is to trade with blindfolds on, at best.
To yours truly, just like other asset classes such as stocks, bonds become most interesting for trading opportunities either when they break past meaningful technical levels, or reach extreme overbought or oversold readings.
TLT ETF Charts
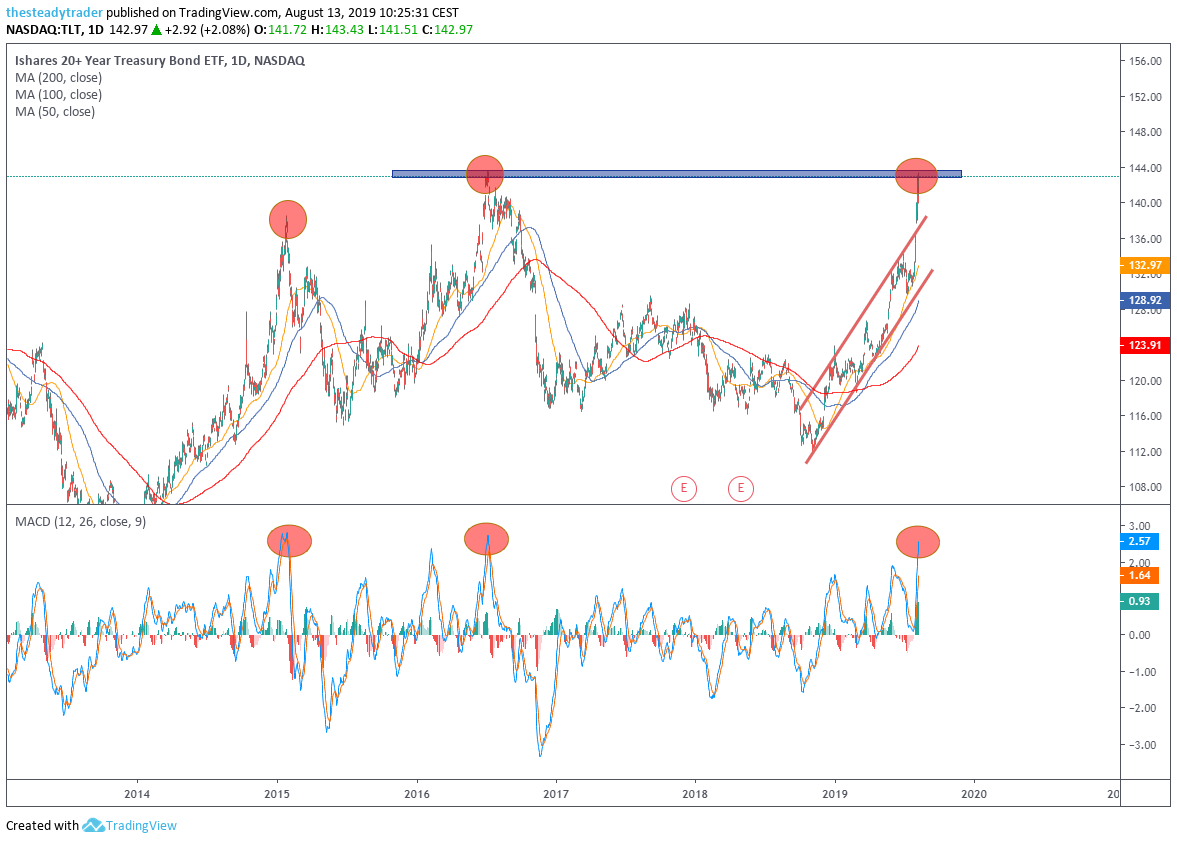
To wit, in recent days, the TLT ETF on the multi-year chart reached its technical resistance highs from July 2016. This also coincides with historically vastly overbought readings from the MACD momentum oscillator at the bottom of the chart (both on the daily as well as the weekly charts). Also note that the year-to-date rally took place in an already steep up-trending channel (red parallels), out of which the TLT ETF went parabolic in recent days to reach the aforementioned resistance highs.
Another way to look at overbought readings in the bond ETF’s chart, or at least one way that market participants are increasingly getting nervous about the rally, is by noticing the implied volatility levels.
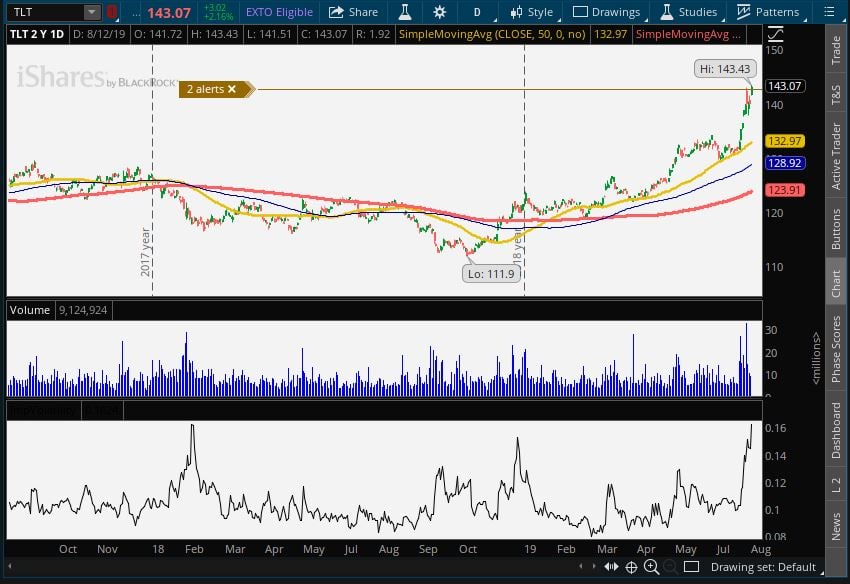
At the bottom of this chart we see that implied volatility in recent days reached levels this ETF last saw in early 2018 and December 2018. Both times, as high implied volatility struck, bond prices ultimately either fell or stagnated for a few weeks.
At this point, active investors and traders could look to short the TLT ETF around the $142 – $144 area. A first downside target is $138 and any further big rally spike would be a stop loss.
My clients and I prefer to structure a trade in the highest probability manner, which, in this case, means selling a very specific options spread on the TLT ETF.
In order to teach this special options trade I am holding a webinar for InvestorPlace readers on Thursday Aug. 15. Register here.
Join Serge in an exclusive live webinar: The steady income options strategy. Register HERE.