Oil and gas giant BP plc (ADR) (NYSE:BP) reports earnings Tuesday morning. So what’s in store for BP stock investors?

Let’s take a look at recent announcements for BP, analyst expectations, the price chart and what, if anything, BP’s options market suggests for bulls, bears and less-directionally motivated traders.
BP Stock Earnings Picture
Ahead of BP’s first-quarter earnings release analysts are forecasting profits of 39 cents per share. Range estimates are from 30 cents to 45 cents. Street expectations imply an increase in profits of about 129% from the year-ago period. Earnings volatility from quarter-to-quarter is also apparent in relation to Q4’s profit miss of just 13 cents.
On the sales side, BP stock is expected to grow revenues by 34% to $51.7 billion. That compares to last year’s, same quarter result of $38.5 billion. Following last quarter’s 29% sales miss, sequential revenues are forecast to be down a modest $400 million.
Analyst Community
Wall Street is mixed-to-bullish on BP stock. Among 33 polled analysts, just 12 firms, or 36%, have “buy” recommendations. An “outperform” rating has two votes, while the most popular rating is a hold on shares with 19 recommendations, or 58% of analysts.
BP stock’s median forecast is a bit more optimistic with a 12-month target price of $38.08. Compared to current share price of $34.47, this implies growth of nearly 11%. Range views span from a low of $29.69 to a high of $46.91.
BP Stock’s Short-Term Trading Record
BP stock has established a consistent pattern of not being, for a lack of a better word, consistent as it relates to Street profit views versus actual earnings. Over the past 12 quarters the company has topped forecasts six times, or 50% of the time, and disappointed on six occasions.
Investor reaction responsible for that other bottom line has taken notice and shown its appreciation by establishing a record of mixed-to-bearish and volatile moves in the aftermath of earnings announcements from BP. Working backward, shares of BP have moved -3.96%, -4.04%, -0.89%, 5.36%, -8.45% and -0.77% on a close-to-close basis.
The net reaction in BP stock has produced an average loss of -2.12% with variability of 4.61% based on a one standard deviation reading. Combining the two metrics and the recent price history has resulted in an estimated range of -6.73% to a gain of 2.49% and a bearish lean in shares.
BP stock’s seven-day stock performance tracks similarly, but with a bit more downside risk for investors. The worst occurrence showed a decline of -11.48%. An average loss of -2.81% for the period coupled with variability of 6.42% yields an estimated range of -9.23% to 3.61%.
BP Stock Weekly Chart
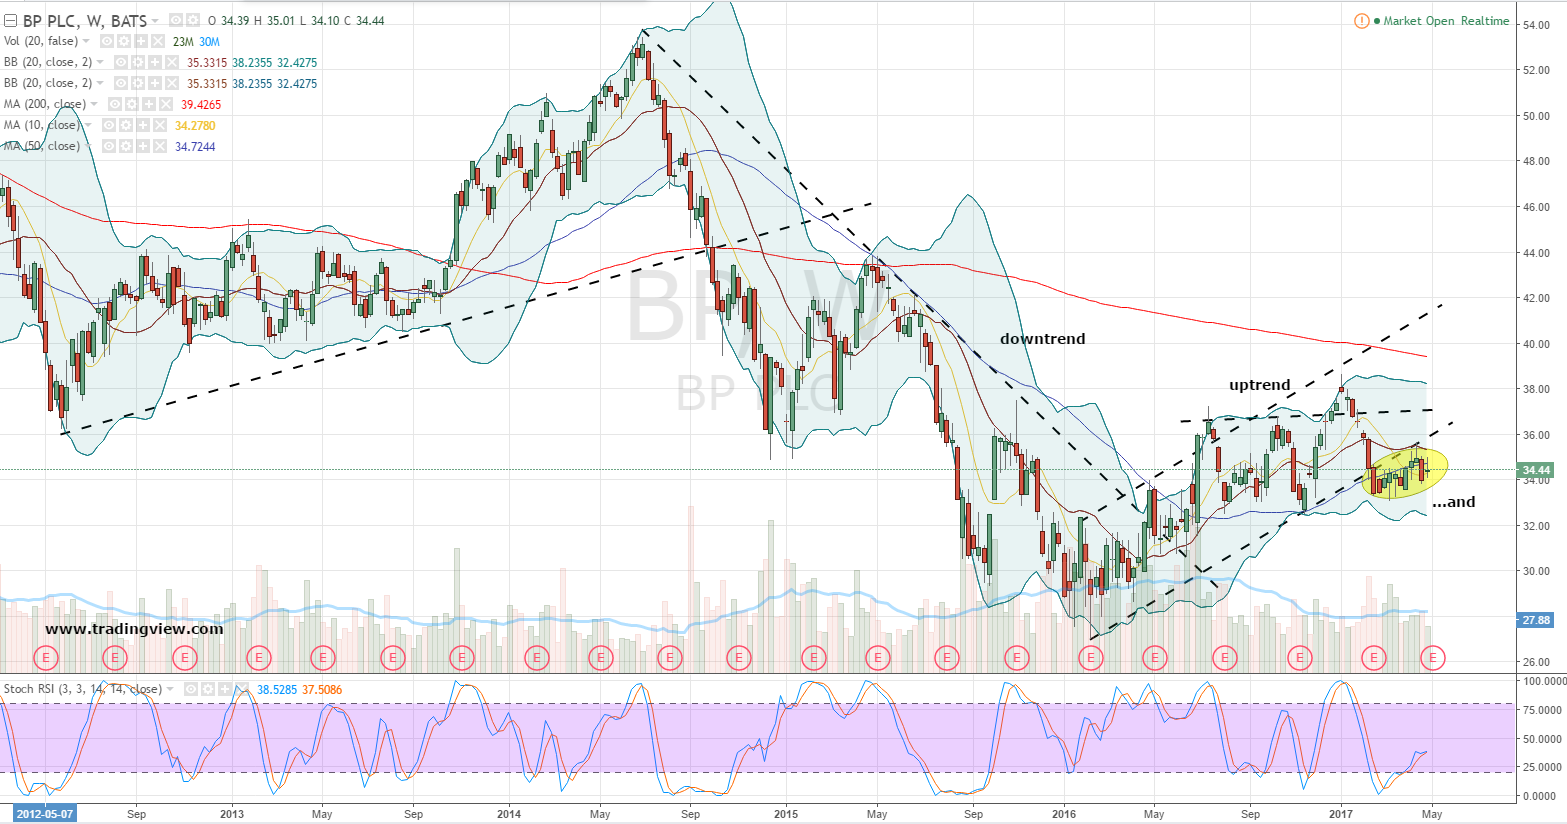
Click to Enlarge
After establishing an uptrend off 2016’s early lows, BP has formed what appears to be a bearish flag following a February breakdown of uptrend channel support. The advantage going forward is for bearish-oriented positioning.
If I were to fade the current technical setup, I’d elect to wait for a move above the drawn in horizontal line at $37. The required move of 7% is greater than any recent bullish post-earnings reactions in BP stock, signalling a failure of the bear flag and reassertion of the uptrend.
BP Stock Options Pricing
Behind the scenes, implied and underlying volatility have widened over the past month from an overlap situation near 52-week lows. For its part, BP stock statistical volatility remains subdued.
At the same time, prices paid for BP 30-day options have jumped higher into the low 20s, but remain marginally in the lower part of the 52-week range. Options traders can expect a narrowing of this volatility spread following Tuesday’s report.
Looking a bit closer at prices and shares at $34.41, the at-the-money Weeklys 5 May $34 straddle market points to a 68% chance BP stock will remain within an approximate price range of $33 to $35.80 into Friday’s expiration. The math behind the range calculation in BP stock is based on implied volatility of 30% with seven calendar days remaining.
The Weeklies contract is the purest play on BP’s earnings, as there’s less opportunity for extraneous market noise to influence how traders would otherwise react to the event. Of course, for those positioning in these nearby contracts, timing, as they say, is everything.
The expected dollar move up or down works out to wiggle room of about +/-4.2% in BP stock by next Friday’s close. As much and in examining both recent one and seven-day reactions, options traders are currently pricing in a normal earnings reaction that falls well inside the recent historical range.
Investment accounts under Christopher Tyler’s management do not currently own positions in any of the securities or their derivatives mentioned in this article. The information offered is based upon Christopher Tyler’s observations and strictly intended for educational purposes only; the use of which is the responsibility of the individual. For additional market insights and related musings, follow Chris on Twitter @Options_CAT.