Nasdaq constituent and semiconductor memory specialist Micron Technology, Inc. (NASDAQ:MU) reports earnings Thursday night, and investors are sure to have their eyes on trends for Micron’s DRAM and NAND chips.

Let’s take a look at recent announcements for MU stock, the price chart of Micron and what, if anything, the options market is suggesting for bulls, bears and less-directionally motivated traders.
MU Stock Earnings Picture
Ahead of MU’s Q2 earnings release analysts are forecasting profits of 80 cents per share. Range estimates are from 62 cents to 89 cents.
Street expectations imply a huge turnaround for MU from the year-ago period when the memory specialist lost 5 cents. However the reversal is part and parcel for a cyclical industry and Micron, which is seeing a nice upswing in business due to its in-demand mix of DRAM, NAND and flash memory.
By the same token, revenues are expected grow by 59% to $4.6 billion compared to 2015’s same quarter sales of $2.7 billion. Sequentially, MU is forecast to show an increase of 15% from Q1’s sales of $4.0 billion.
Analyst Community
By and large the Wall Street community is bullish on MU stock. One survey of 24 analysts shows a median price target of $31 a share, range high of $45 and low of $25 which sits just 2% below Micron’s current price of $25.52.
Spied recommendations on Micron shares reveal a similar type of optimism. Currently 23 analysts maintain buy ratings. Two analysts have an outperform rating on MU and 4 have issued hold recommendations on Micron. At the same time, MU doesn’t have a single underperform or sell rating.
And in a class all by himself, CNBC’s James Cramer rated MU stock as “a tiger that needs to be ridden” back in January, supported by his belief Micron is just now entering a cyclical bull market.
MU Stock Short-Term Trading Record
MU stock has established a solid pattern of beating Street profit views in topping estimates in five of its last six quarters and the lone outlier, matching analyst views. Investor reaction responsible for the bottom line on the MU stock chart has proven a good deal more mixed and volatile.
Working backward, shares of Micron have moved 12.68%, -9.16%, -0.10%, -2.12%, 7.72% and -18.15% on a close-to-close basis.
The net reaction has produced an average loss of -1.52% in MU stock, which somewhat marginalizes variability of 11.17% based on a one standard deviation reading. Incorporating that measure yields an estimated range of -12.69% to 9.65%.
MU’s seven day stock performance has shown similar results with an average gain of just 0.58%, but sporting variability of 16.63%.
MU Stock Daily Chart
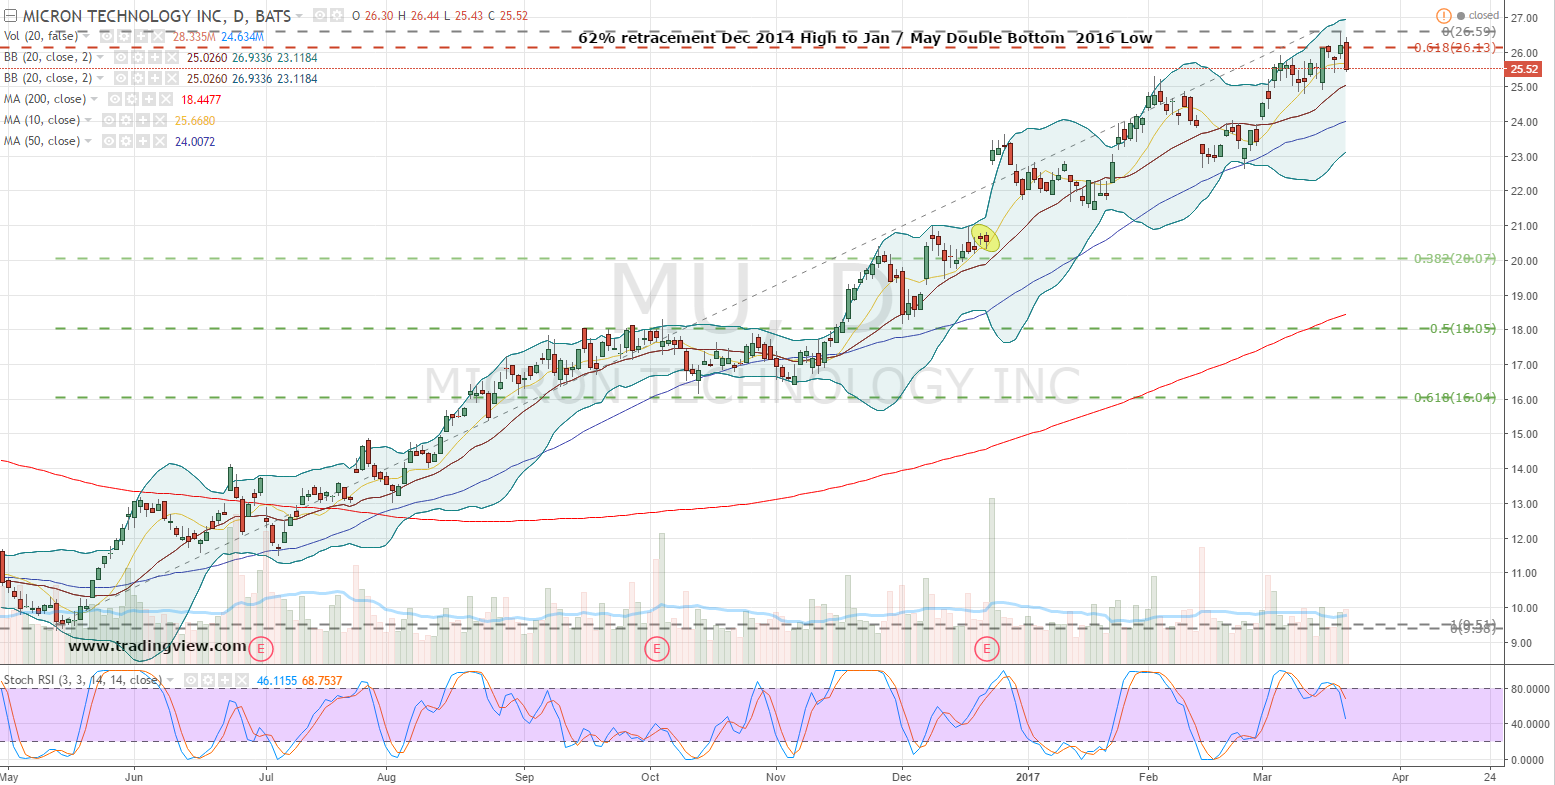
Click to Enlarge
There’s no doubt the price action in Micron has turned the tide on bears, but this week did find shares failing at the 62% retracement level from its prior cycle high in late 2014.
As well, given MU’s solid rally plus the more tenuous status of the broader market, MU could be due for a correction within its uptrend.
Based on our peek at recent earnings reactions and some sizable declines in MU stock despite topping Street views, a move into the low $20’s can’t be altogether ignored. Were that type move in Micron shares to occur, a reaction toward $20.50 would have the upshot of filling the prior quarterly report’s bullish price gap and establishing a healthy and very common corrective move of 21% — “booyah!”
MU Stock Options Pricing
Behind the scenes, implied and underlying volatility in MU have seen a widening of their spread with premiums increasing above actual stock volatility over the past couple weeks. Considering earnings and an extended run in MU, it’s far from surprising behavior, though.
As well, while implieds have lifted, statistical volatility remains near 52-week lows. Premiums or implied volatility for the 1-month contract is roughly 40% below its highs established late last winter as Micron stock flirted with its multi-year lows.
Closer to the action, the at-the-money 24 March $25.50 straddle market points to a 68% chance MU will remain within an approximate price range of $23.55 to $27.85 into Friday’s expiration. The math behind this calculation is based on implied volatility of 91% with four trading sessions remaining.
The Weeklys contract is the purest play on the MU stock earnings event, as there’s less opportunity for the reaction by traders to be impacted by broader market noise. In turn, those calls and puts typically live and die by the sword of the latest report.
The dollar move up or down works out to expected wiggle room of about 8.3% in MU by Friday’s close. In weighing both recent one and seven-day reactions, it appears options traders are pricing in a volatile, but so far, normal earnings reaction.
Investment accounts under Christopher Tyler’s management do not currently own positions in any of the securities or their derivatives mentioned in this article. The information offered is based upon Christopher Tyler’s observations and strictly intended for educational purposes only; the use of which is the responsibility of the individual. For additional market insights and related musings, follow Chris on Twitter @Options_CAT.