If you’re a certain type of investor and watch those all-important levels for your buy decisions — Exxon Mobil Corporation (NYSE:XOM) is a certain buy. But to support that decision in the event of bearish price revisions, a collar spread on XOM stock is a favored strategy. Let me explain.

When it comes to investing, there are two basic, but major philosophies on how to approach buying Exxon stock.
There’s those who look at company fundamentals and key industry data such as oil inventory levels to build the needed support and confidence prior to making a purchase in XOM.
A second method for making a buy decision in XOM is technical or chart-driven. Traders reliant on price action and charts view the market as a forward-looking mechanism with prices assumed to have all the important data baked into shares.
I personally look at both information sets in making investment decisions. But I’m especially inclined to go with the technical approach in Exxon Mobil stock given commodity markets are notorious for trading based off of key price levels. I also appreciate the relevance of the expression, “when in Rome …”
Additional support for using a technical-based approach in XOM comes from all-too-frequent, volatile and typically off-the-mark oil inventory data. Even worse, investors then have to decide how the market will react to the latest numbers and where consistency is largely MIA.
Considering the monthly XOM stock chart, there’s even less need to look elsewhere for price clues in making a buy decision to go long Exxon Mobil stock.
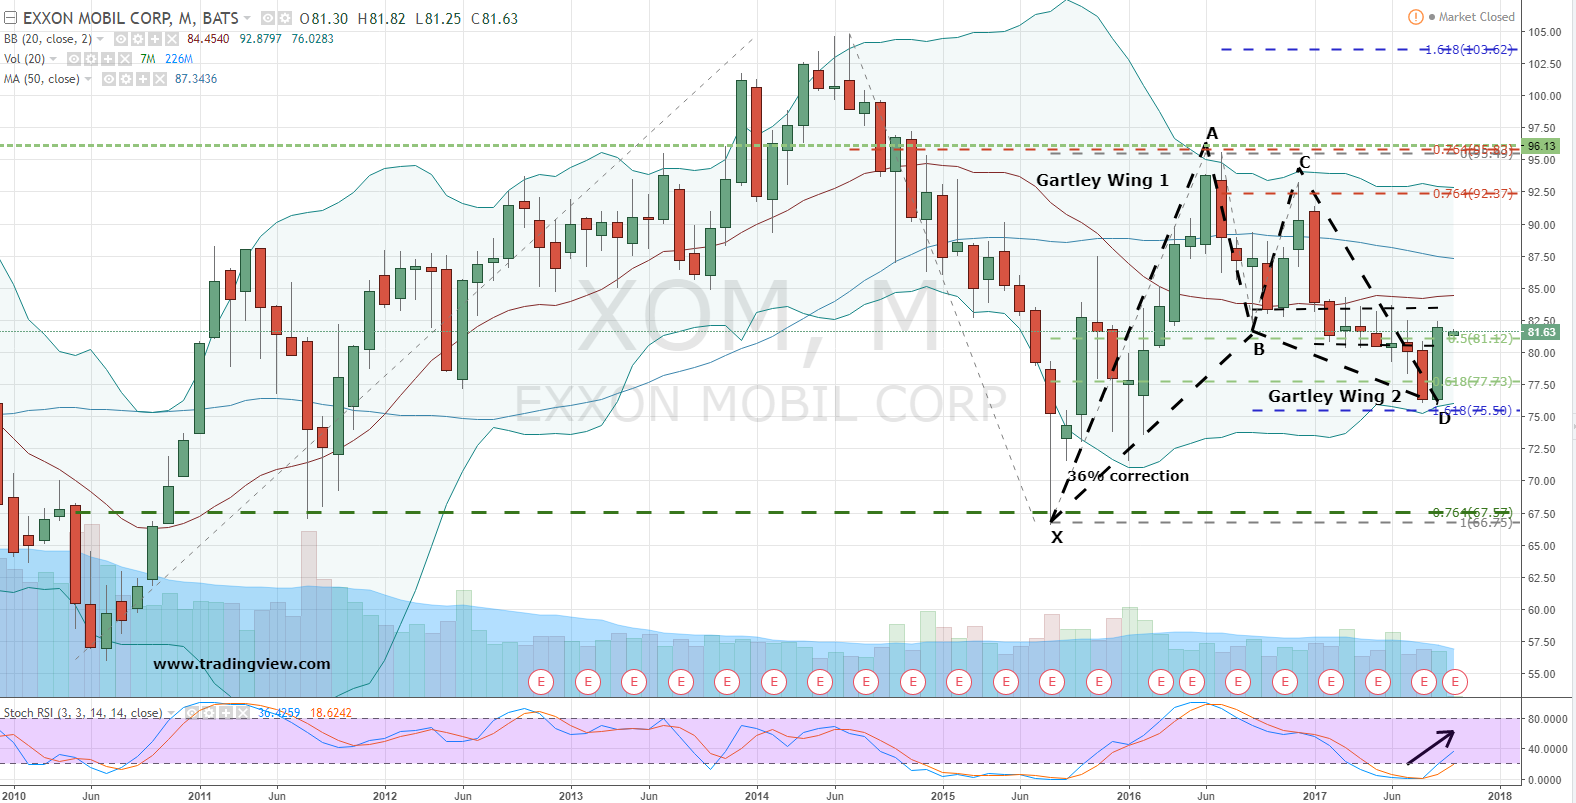
XOM Stock Price: Monthly Chart
Click to Enlarge
In the provided monthly chart I’ve labeled XOM’s Gartley which began at “X” in August 2015 as shares held the 76% retracement level (2010 low to 2014 high) with a large hammer candlestick low.
Subsequent and successful Fibonacci testing over the next two years completed the pattern at ‘D’ with the second wing forming off the 1.62% extension of leg BC.
Now and with XOM stock’s recent rally through the high of August’s pivot low candle of $80.82 in late September, the Gartley pattern has received authoritative price confirmation a low is in place. In turn, this signal builds a strong case for solid upside potential in ExxonMobil in the months ahead.
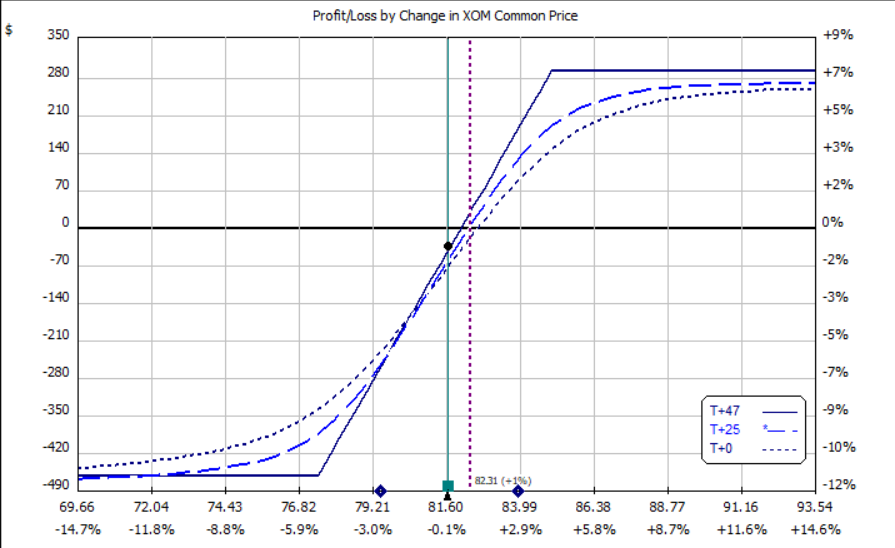
Exxon Stock Collar Strategy
Click to Enlarge
With a bullish monthly signal in hand, and XOM also an attractive dividend-paying stock of 3.84%, one fully-hedged strategy favored by this strategist is the collar. One preferred combination is the Nov $85 call/$77.50 put collar.
This particular collar is priced for $81.83 or just 18 cents more than purchasing XOM outright. For the additional 0.22% premium the collar guarantees if Exxon Mobil comes under pressure, losses are contained to 5.30% within a weakened, but at-risk Gartley pattern.
On the upside, if XOM continues to rally, the collar trader’s initial gains are capped at $85 where the short call used to partially finance the protective put was placed. This means at expiration a profit of 3.87% is possible at or above the short call. Given XOM’s typically lower volatility that type outcome wouldn’t be shabby at all.
Net, net, given XOM’s bullish chart prospects, a strategy which can be adjusted for additional trend profits, this Exxon Mobil spread looks like a worthy investment.
Investment accounts under Christopher Tyler’s management do not currently own positions in any securities mentioned in this article. The information offered is based upon Christopher Tyler’s observations and strictly intended for educational purposes only; the use of which is the responsibility of the individual. For additional market insights and related musings, follow Chris on Twitter @Options_CAT and StockTwits and feel free to click here to learn more about how to design better positions using options!