
The MACD Indicator is a shorthand for a set of trading rules known as the moving average convergence/divergence. It tracks two indicators to help investors know when to buy and sell stocks:
- MACD Indicator. A medium-term signal calculated by subtracting the 26-period exponential moving average (EMA) from the 12-period EMA.
- Signal Indicator. A shorter-term exponential moving average (EMA) calculated over 9 days. This is also known as the “average” indicator.
How Does the MACD Indicator Work?
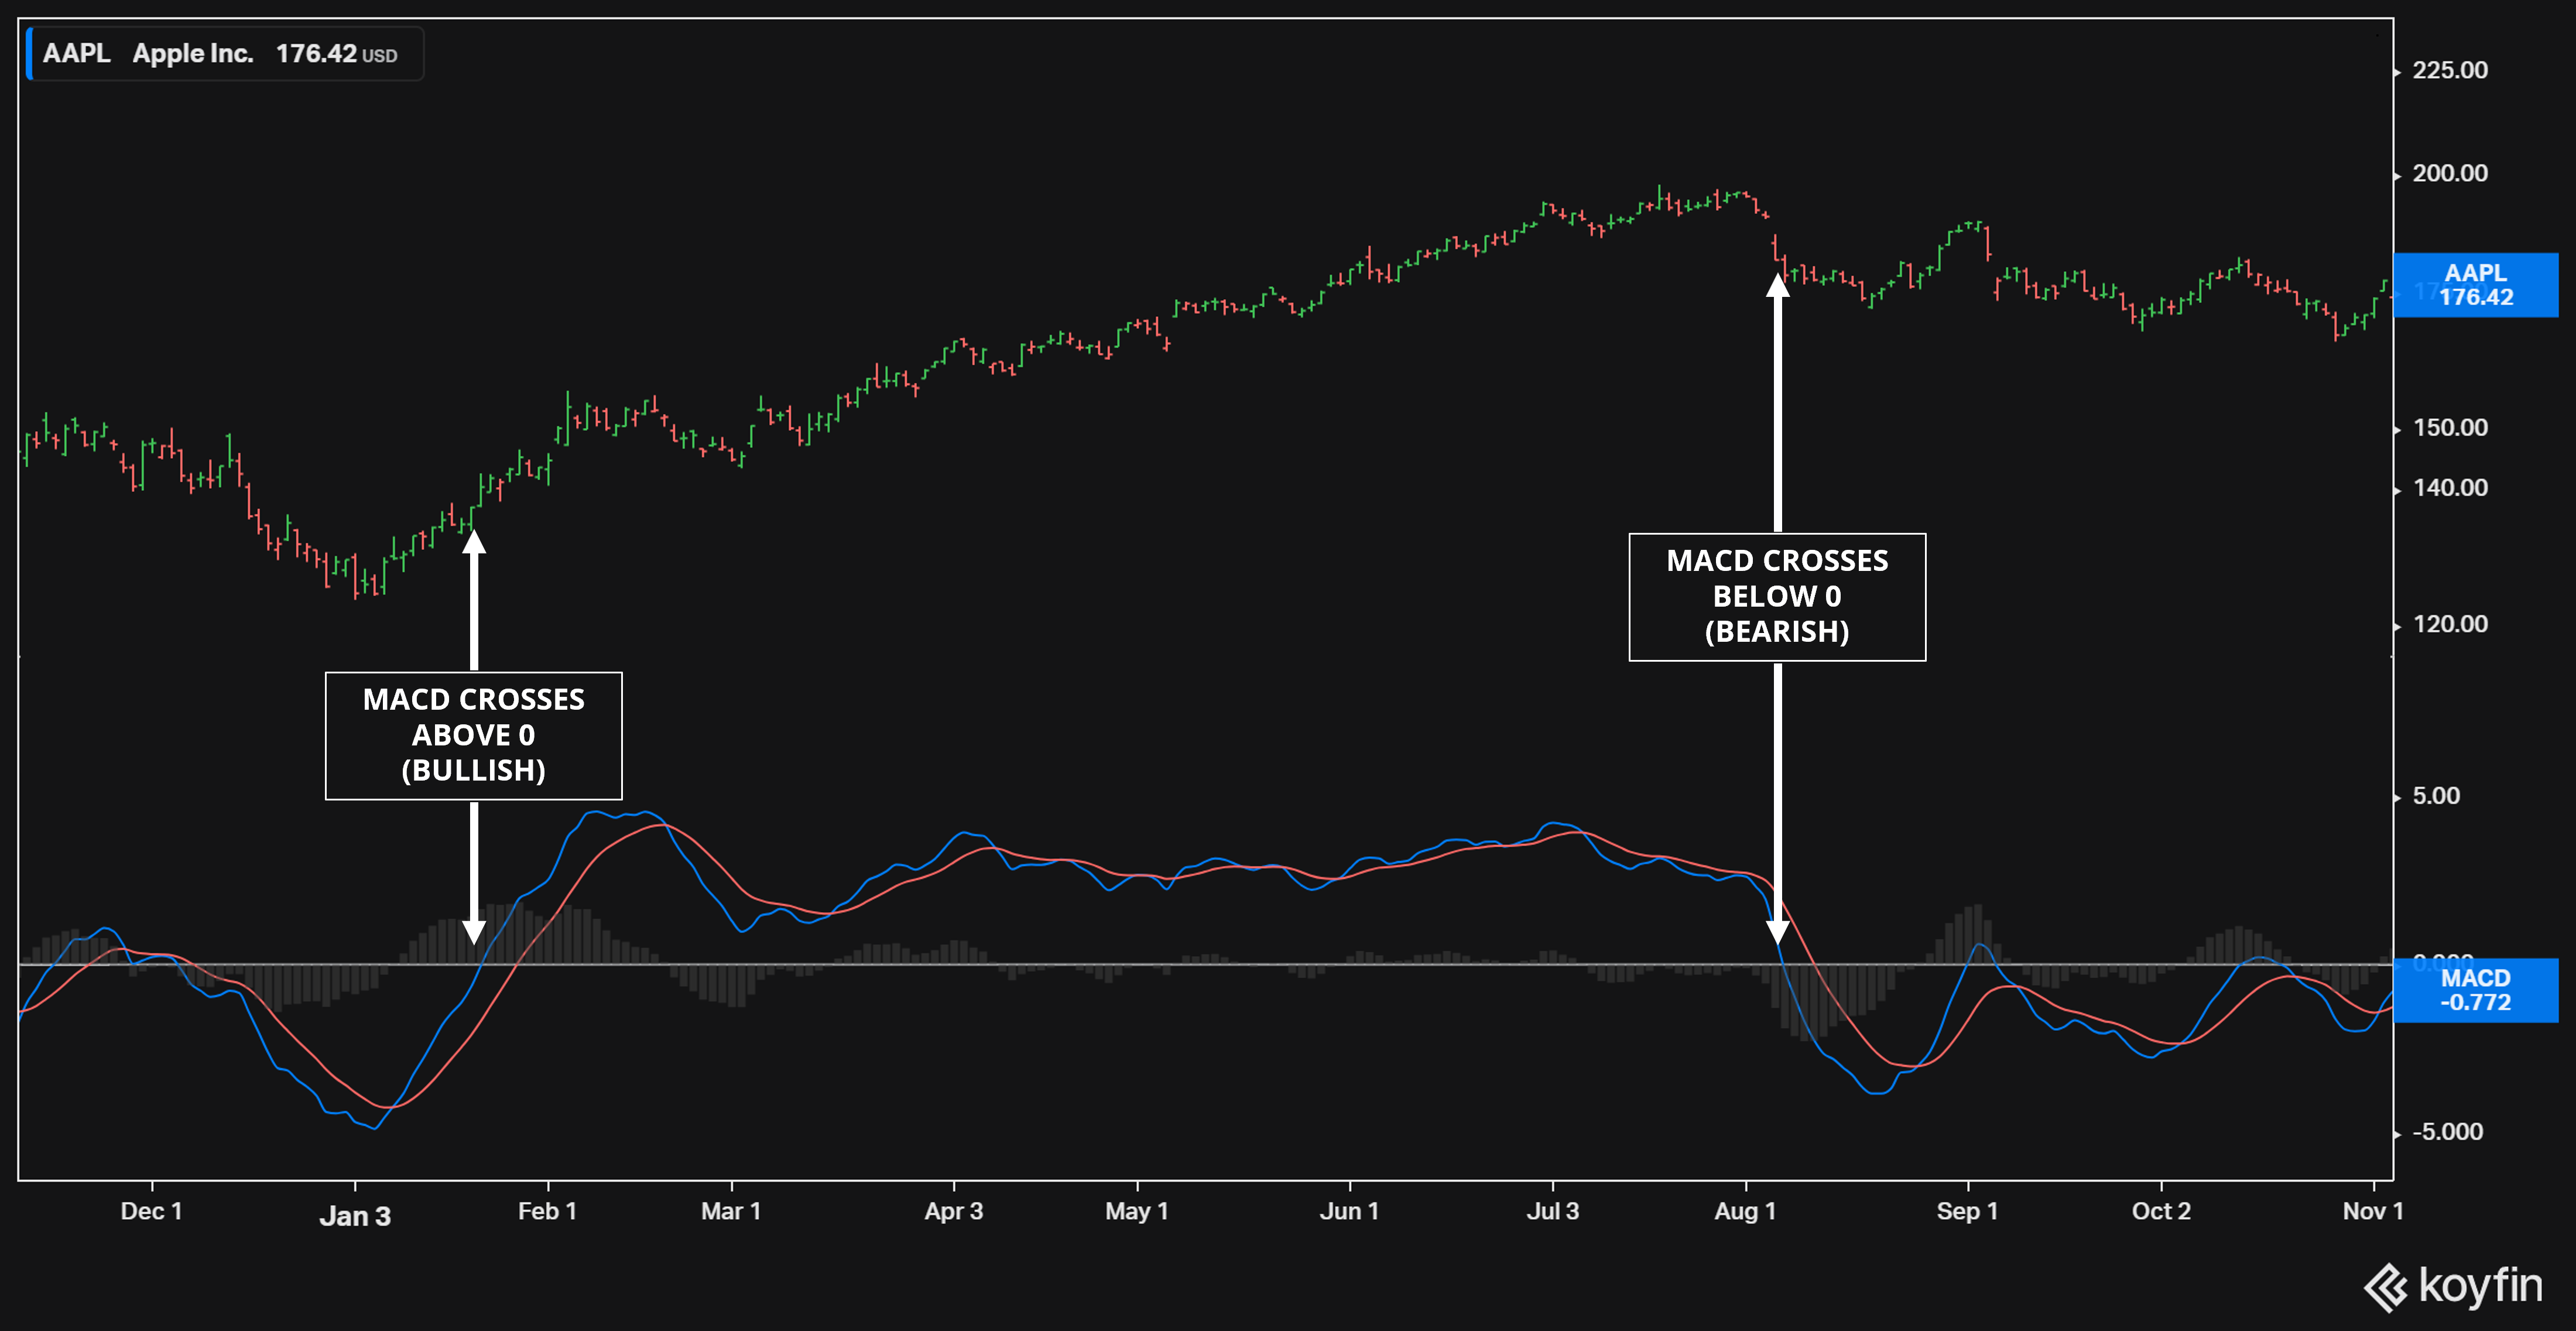
1. Basic Strategy. The most basic MACD bullish signal is to buy when the MACD Indicator crosses over zero. That tells us that prices are trending up and that investors should buy. Conversely, investors should sell when the MACD Indicator falls below zero. Below is a graph of Apple (NASDAQ:AAPL) in 2023 that shows these signals and their following gains. An investor who bought shares in January would have enjoyed a 40%-plus return in less than a year.
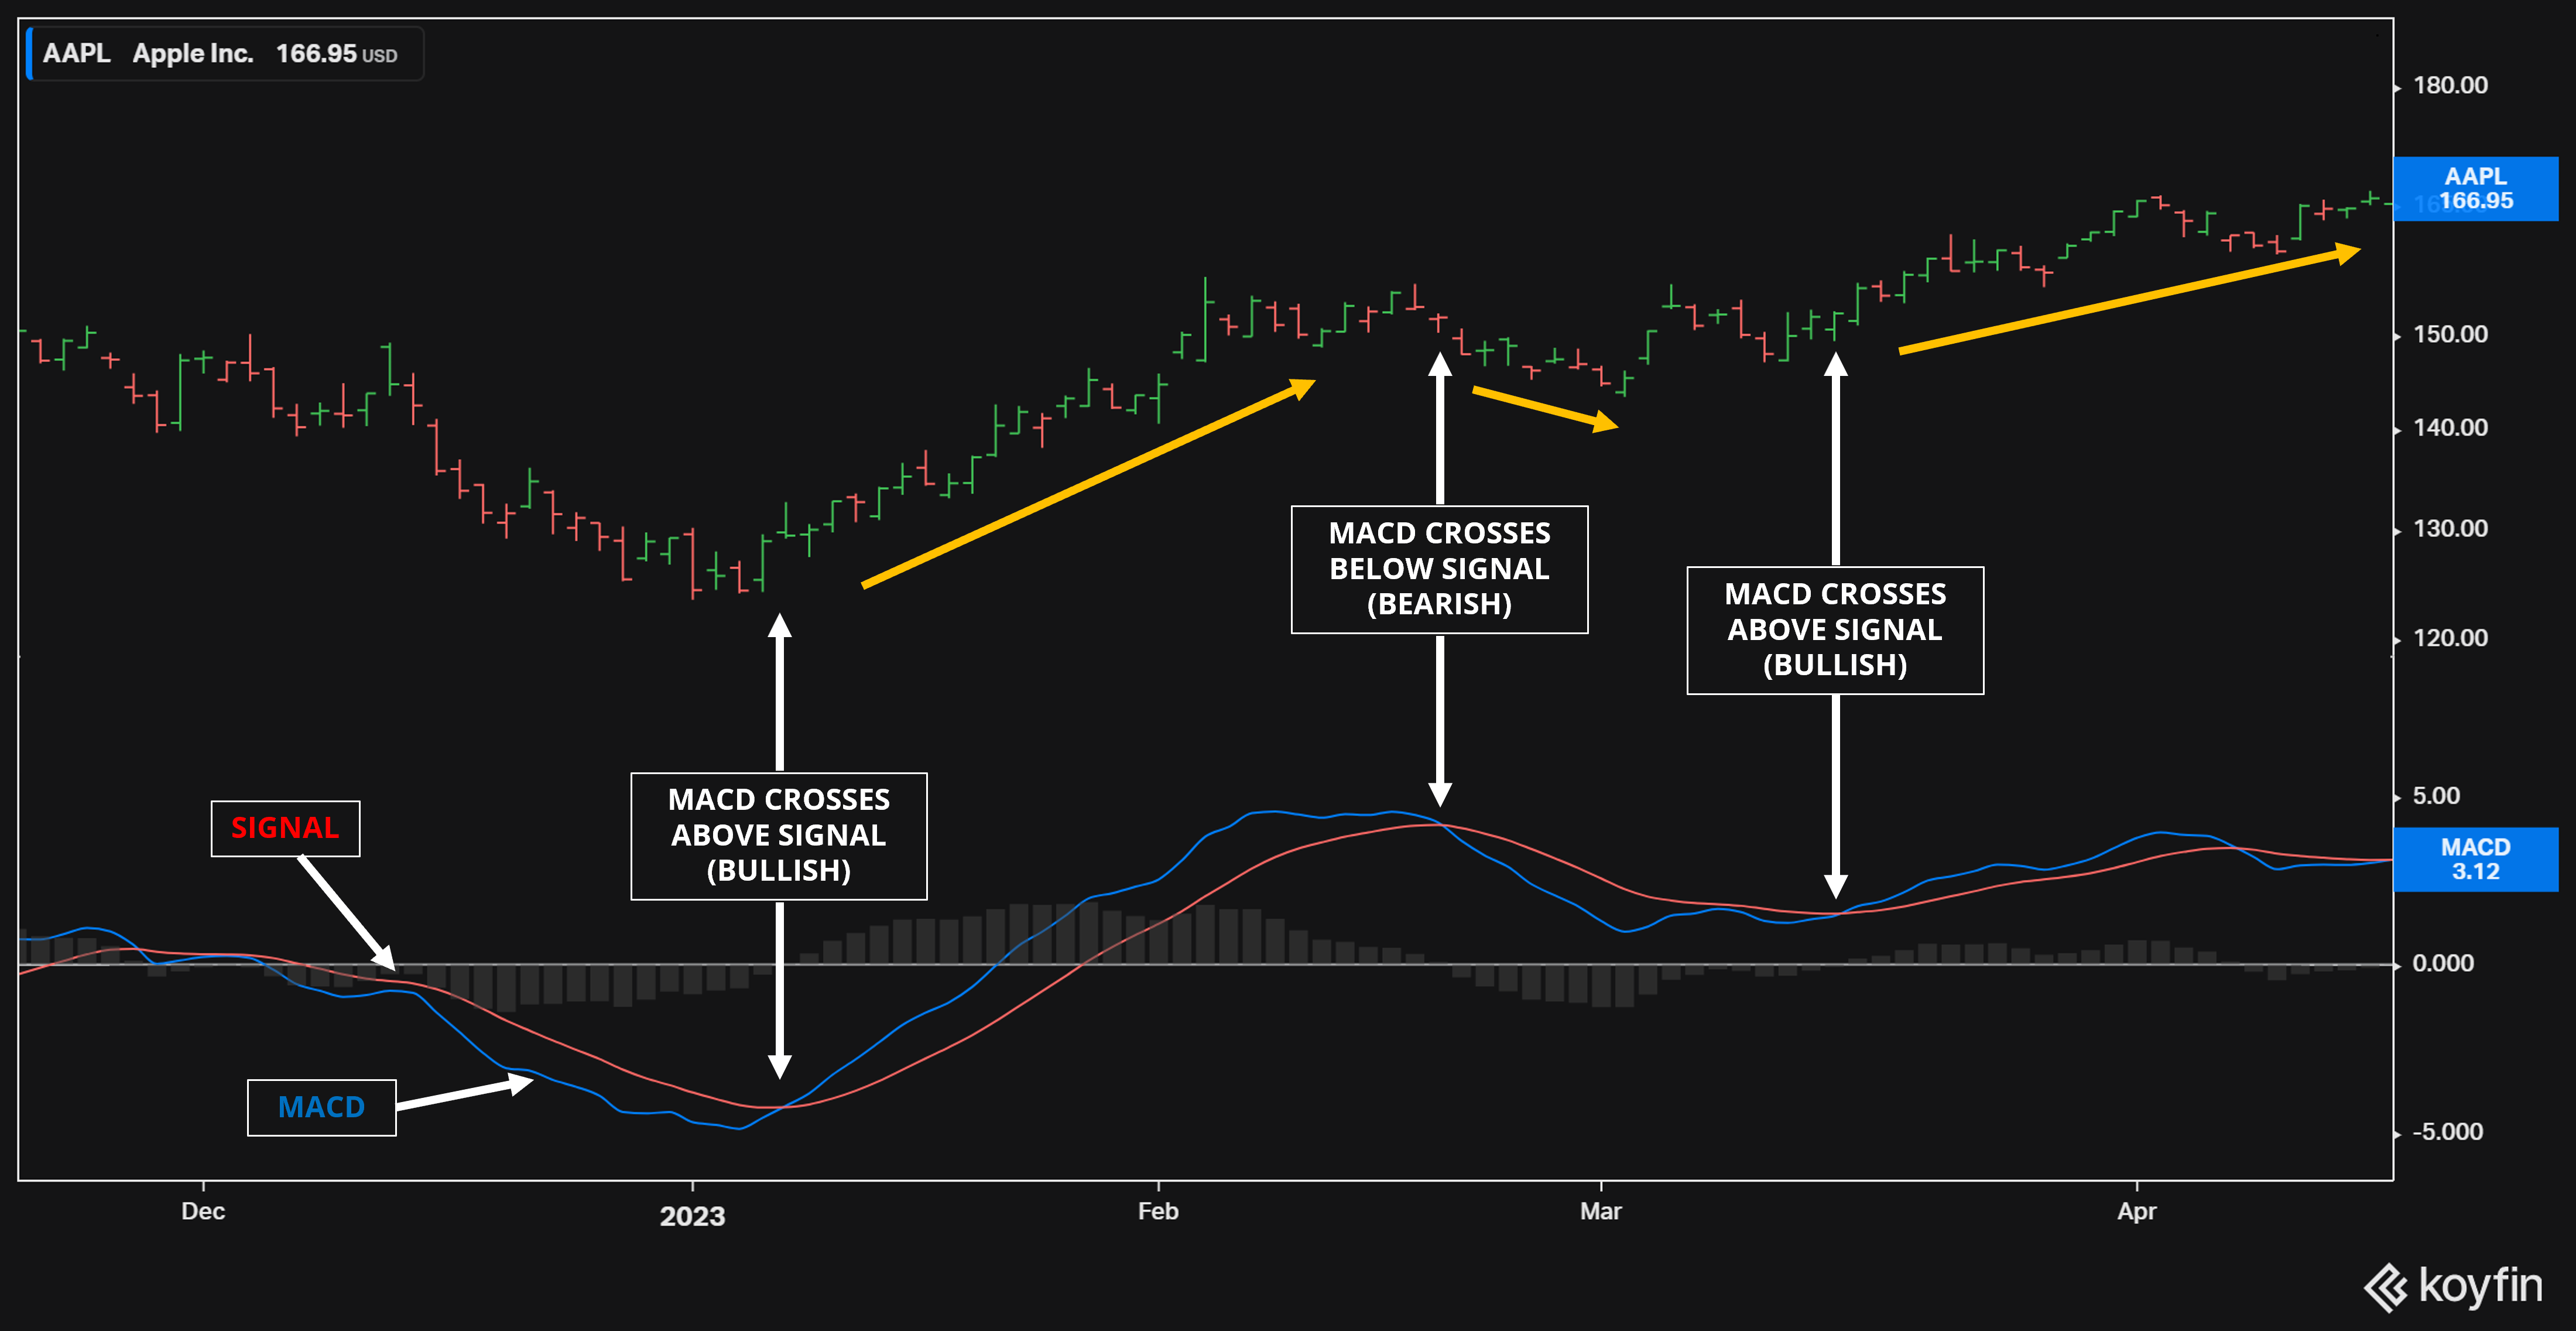
2. Crossover Strategy. A more advanced version is to buy when the MACD Indicator crosses above the Signal Indicator and sell when it crosses below. Here’s the same graph of Apple, zoomed into the first third of the graph above. The more advanced signal was triggered two weeks before the basic one, which would have given investors a $130 entry price rather than one in the higher $140 range. Because these crossover signals are triggered earlier, they’re ideal for more volatile stocks prone to reversals.
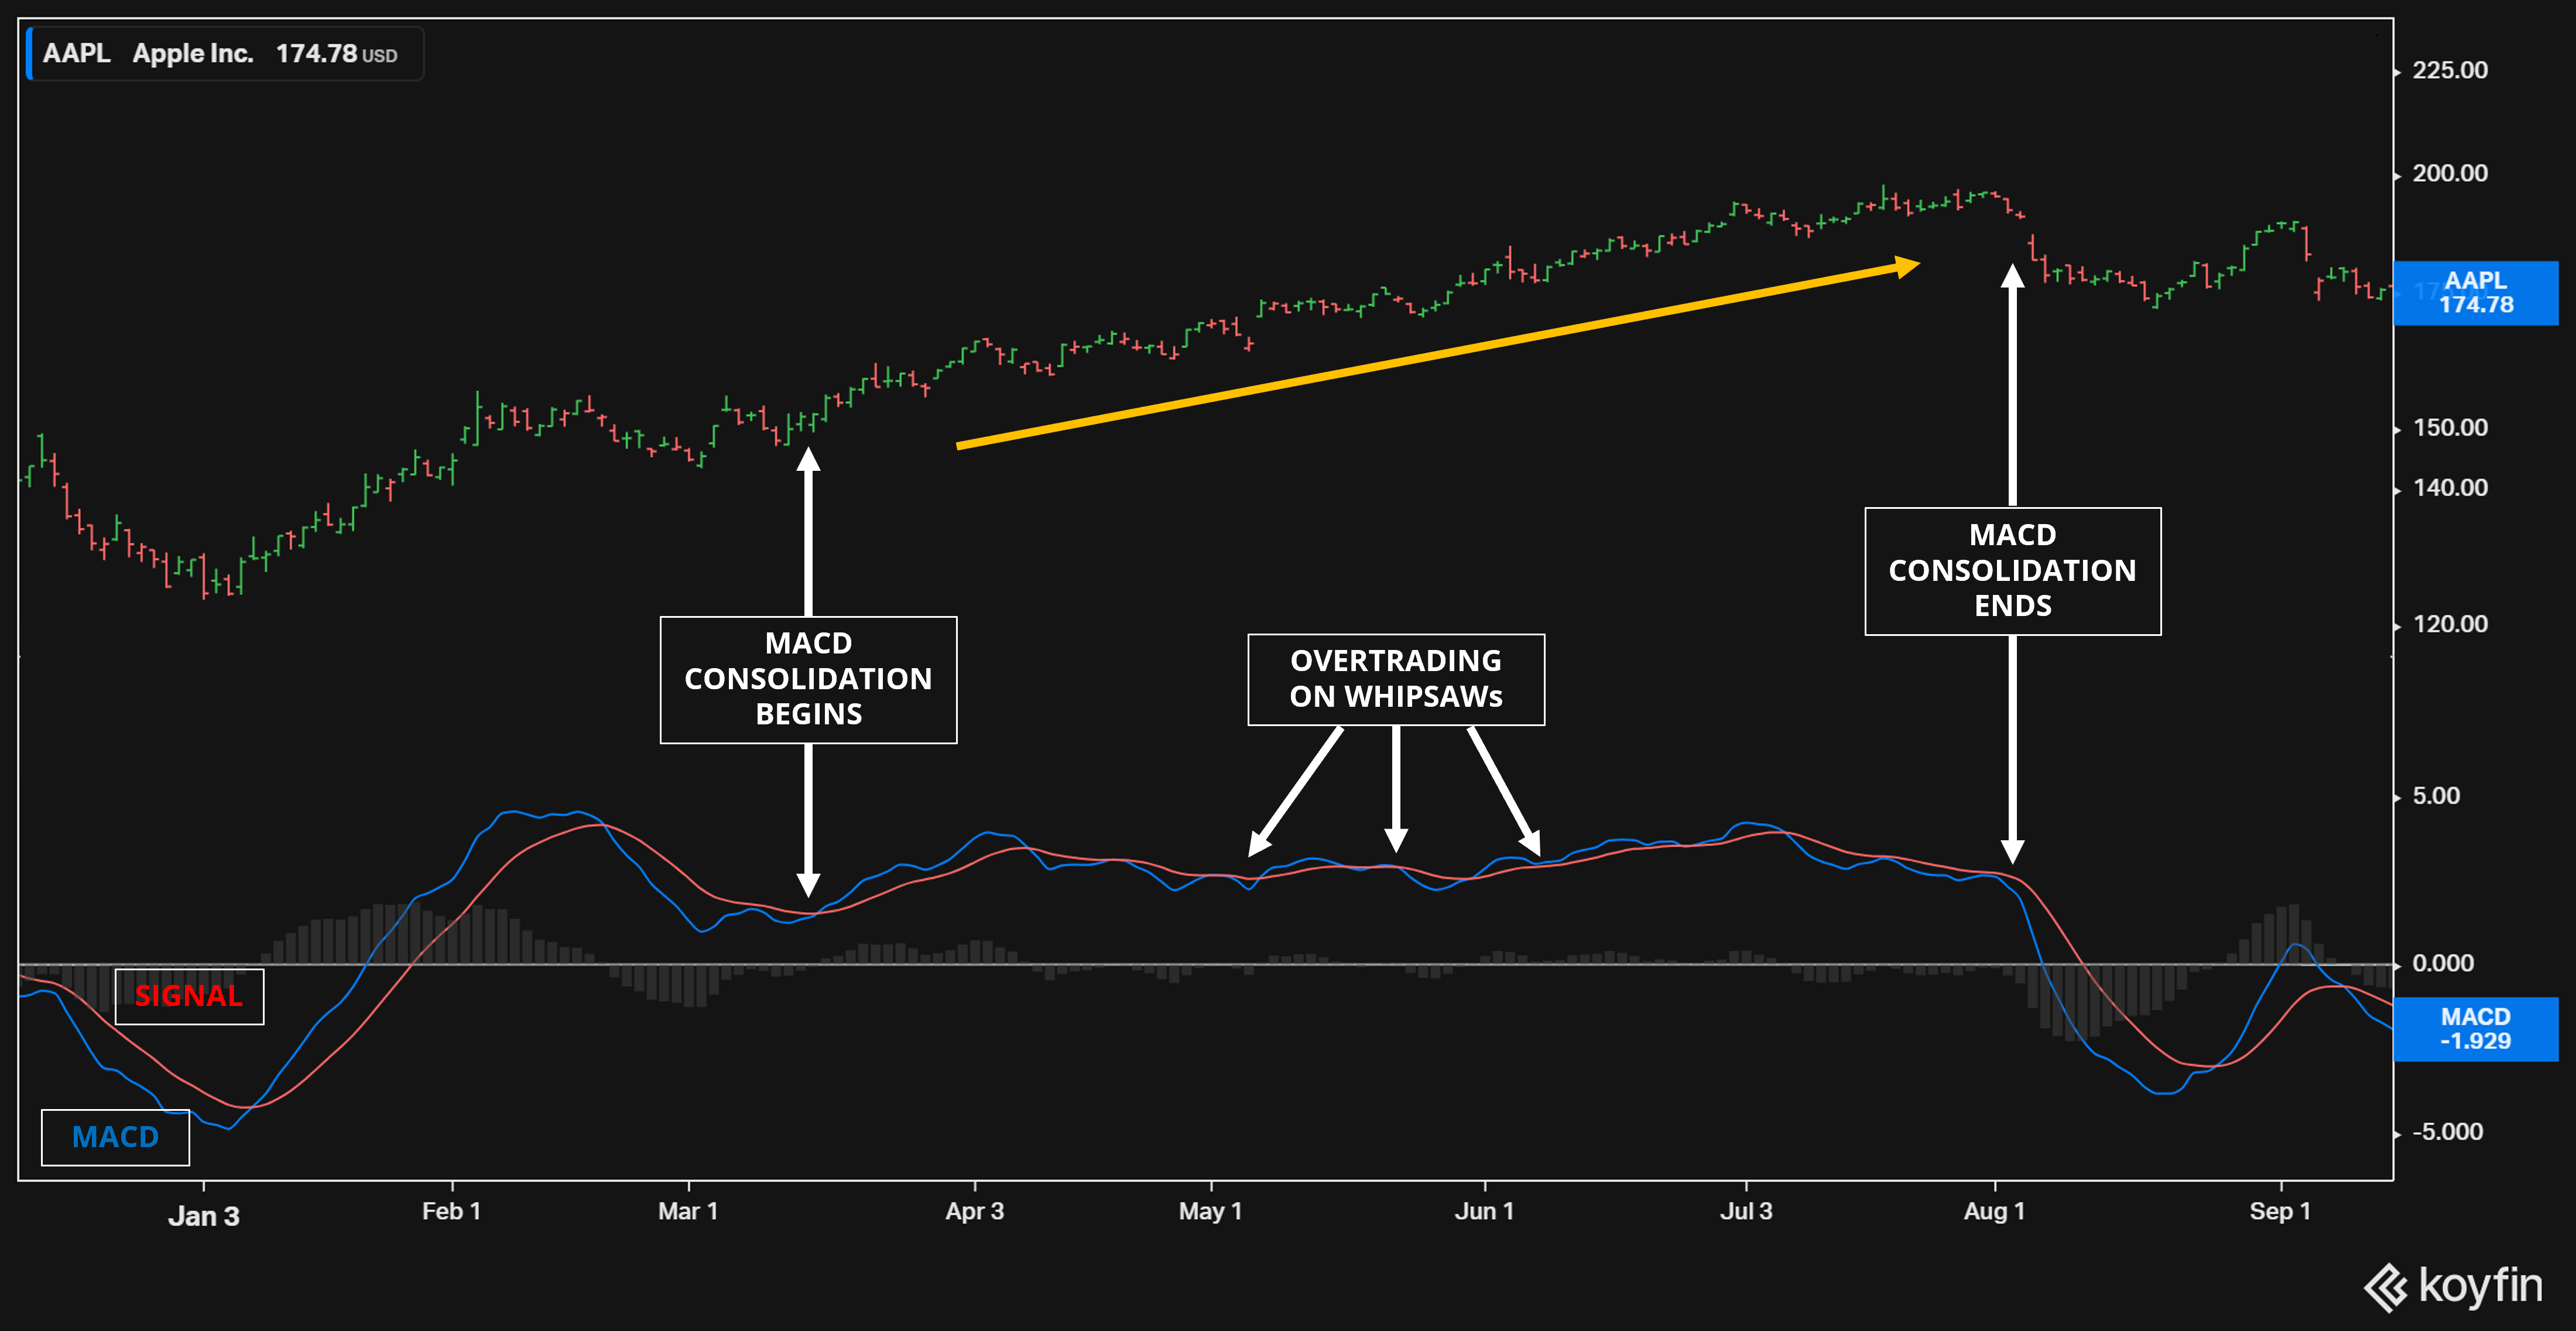
However, the MACD crossover strategy is prone to whipsawing when prices move in a straight line. That’s because the MACD and Signal Indicators can cross over rapidly, causing overtrading and reducing profits. Here’s the same graph of Apple, zoomed in on the middle (April/June) period, where the two lines repeatedly cross during a stable uptrend. Investors would have been better off buying and holding.
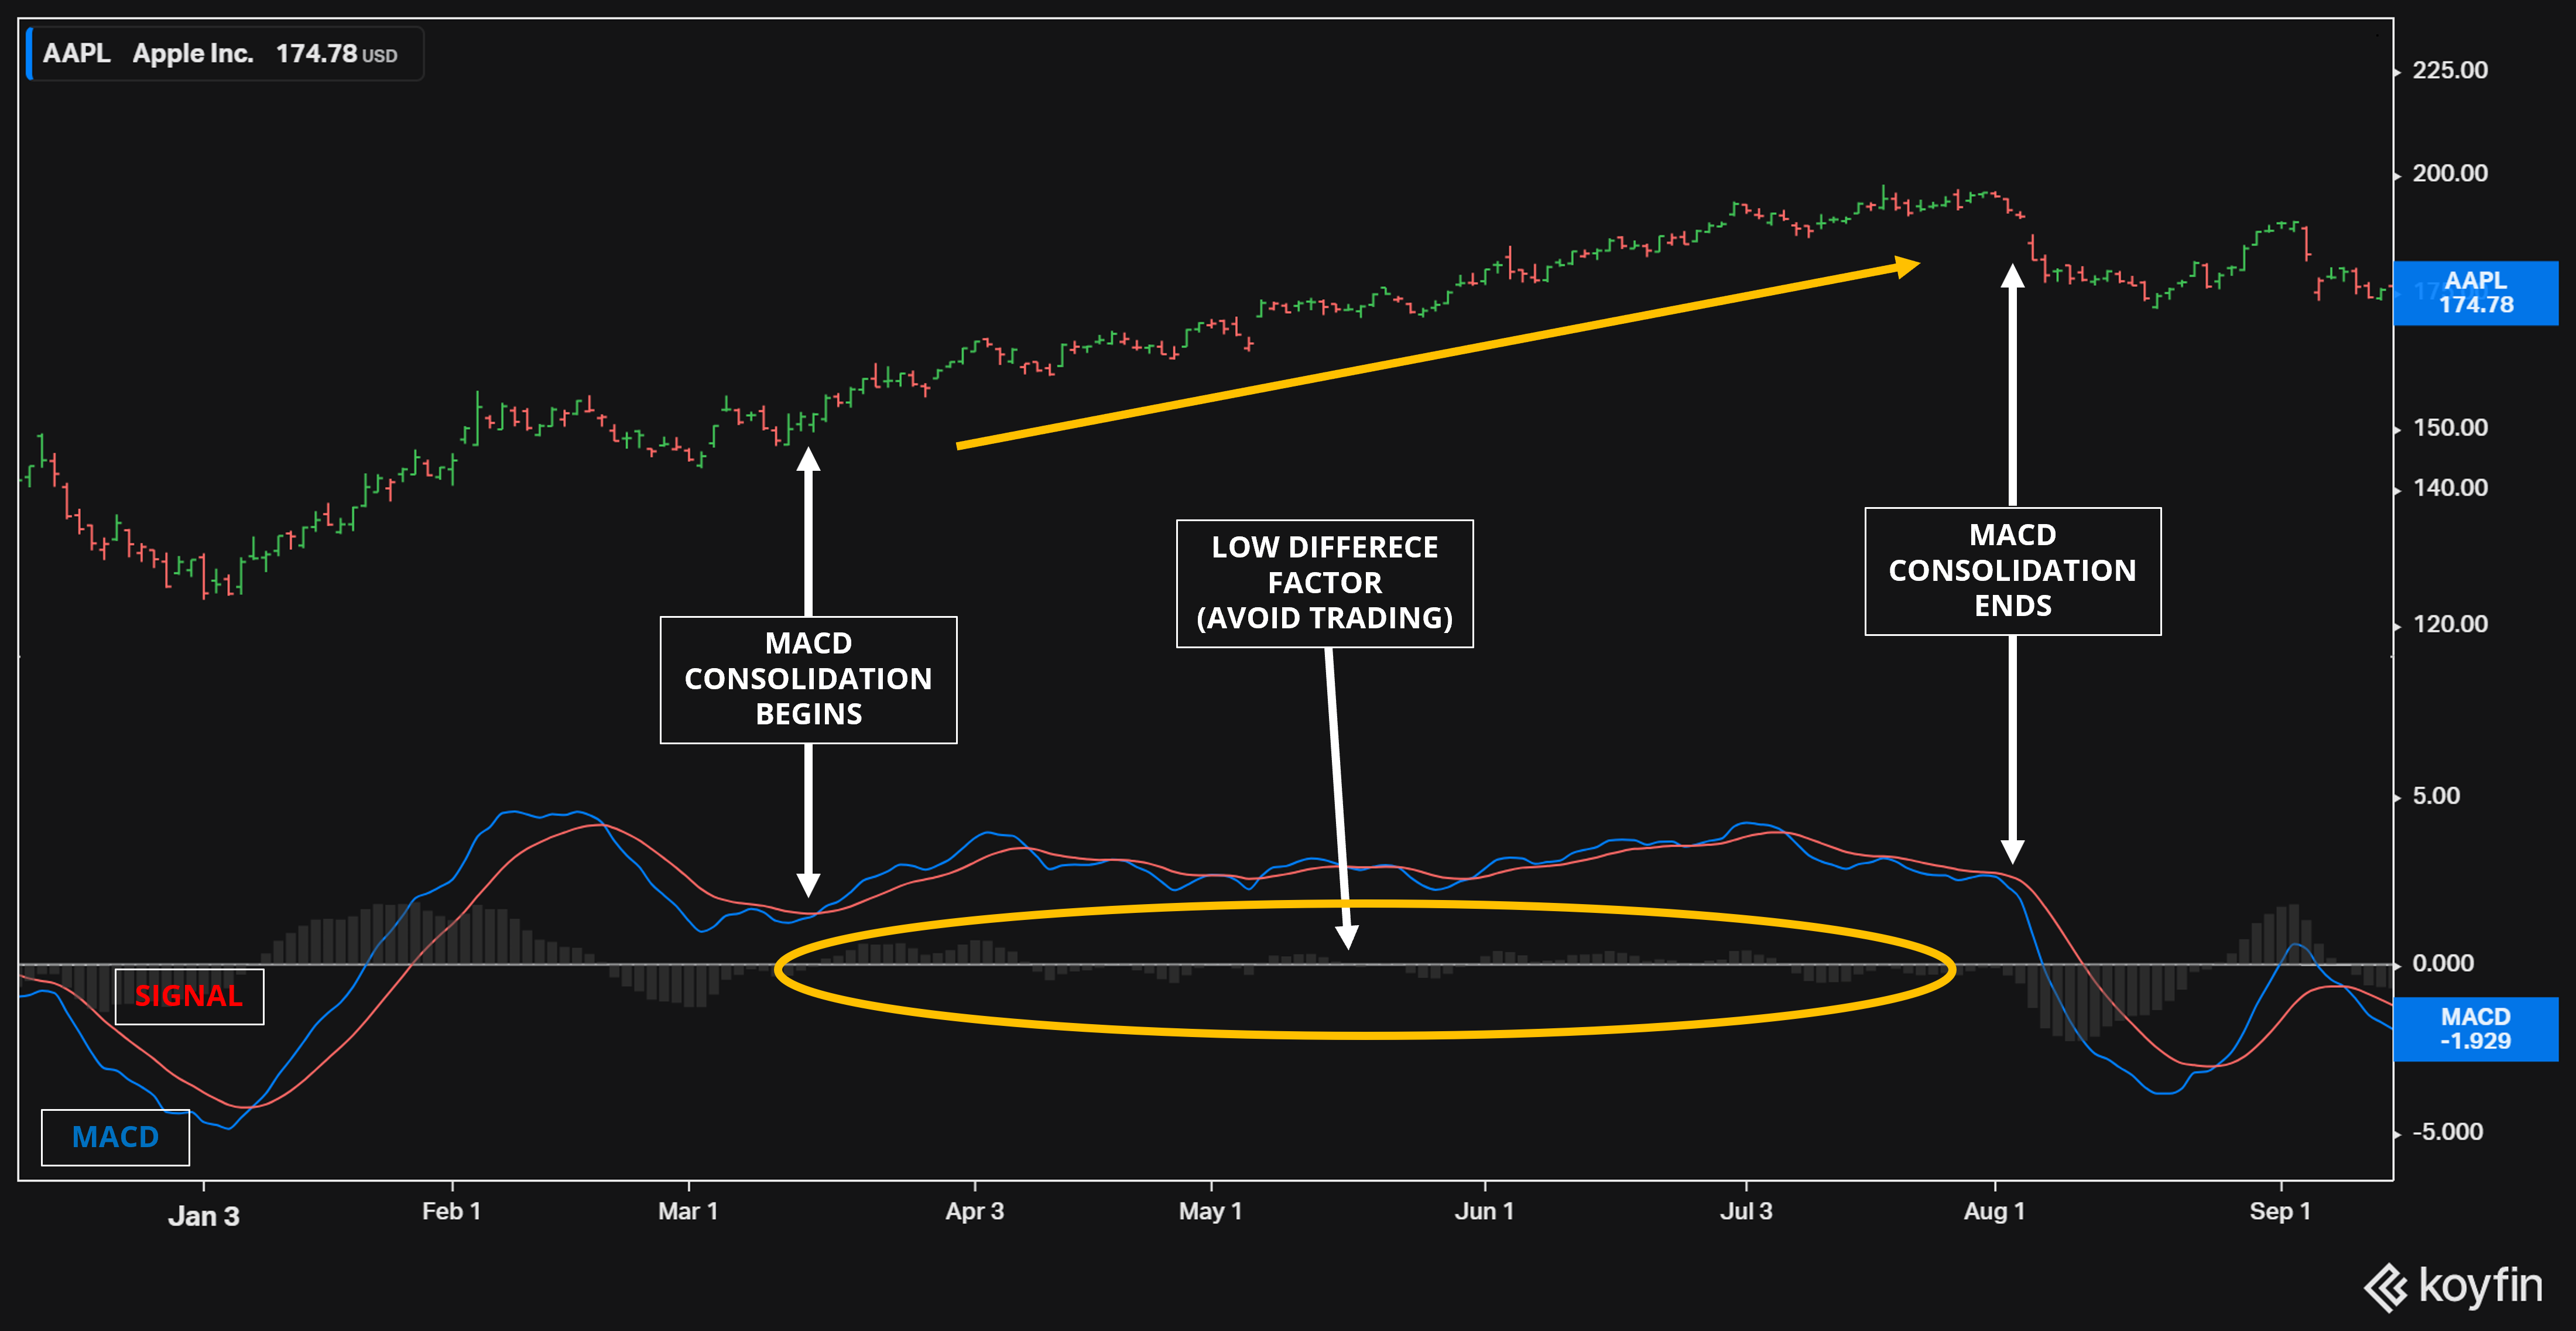
3. Difference Strategy. To address issues with the crossover strategy, a third strategy uses the difference between the two indicators, represented by the light grey bars above, to make decisions. When the gap is too small, it’s a sign to avoid trading since the asset is in a stable trend. And when the lines diverge, it’s a sign to begin re-using the crossover strategy.
Traders also often combine MACD indicators with other techniques, including resistance levels, trend-following and other technical analysis tools. As you’ll see later, some of these combinations work better than others.
How to Calculate the MACD Indicator
Calculating MACD involves getting a list of an asset’s historical prices (usually daily close prices) and finding the exponential moving average (EMA) of the series using the following equation:
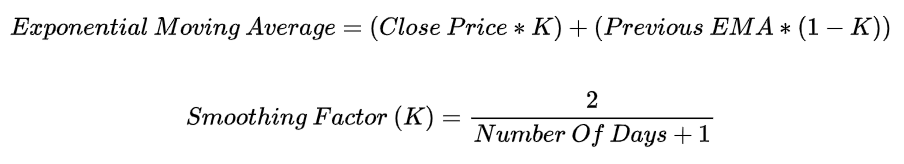
The MACD line is then found by calculating the 12-day EMA, and subtracting the 26-day EMA from that figure. The Signal Line is the 9-day EMA of the MACD line.
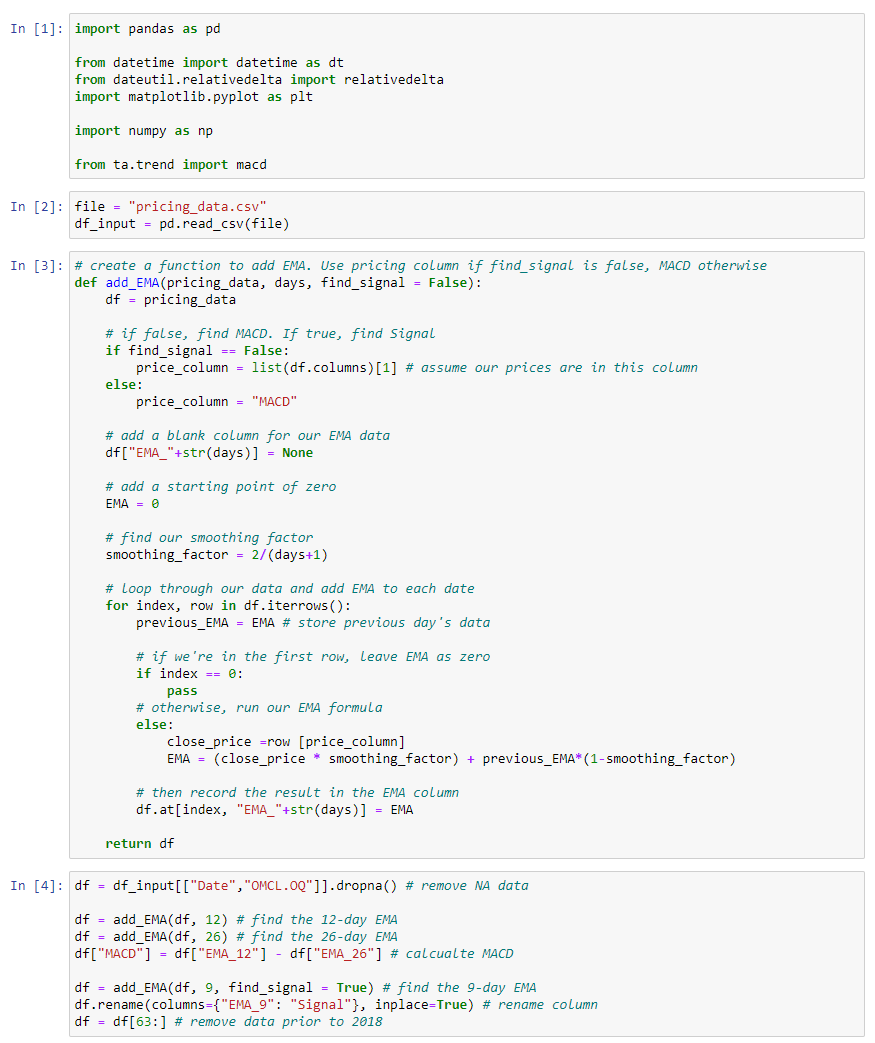
We can calculate this in Python with the following lines of code. Omnicell (NASDAQ:OMCL) is used as an example. Essentially, it runs in four steps:
- Calculate the 12-day EMA from historic prices using the EMA formula.
- Calculate the 26-day EMA from historic prices the same way.
- Subtract the two to find the MACD.
- Calculate the 9-day EMA of the MACD found in step 3.
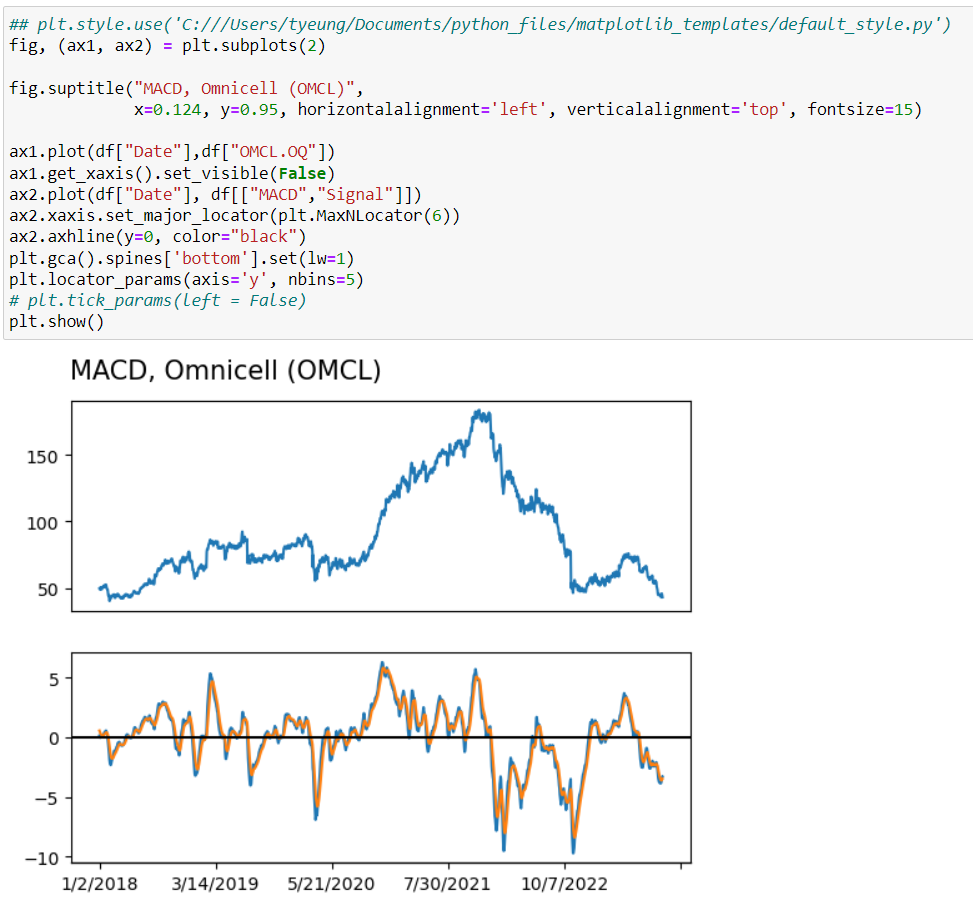
Together, that creates a set of buy-sell signals you can plot over time. Below, you can see how the MACD line turned bullish on Omnicell during its late-2020 rise, and then bearish again the year after. An investor who correctly “read” the charts might have bought in the $60 range and sold out at $150… a 150% profit!
1. Does the MACD Strategy Work?
As we’ve previously seen with other technical indicators, MACD used without fundamental analysis tends to do… not so well. I’ll show this in the following section, but feel free to skip this part if you want to know how MACD can work.
For this part, I’ll use data from Refinitiv, a Thomson Reuters service, to demonstrate this. Our dataset will include all Russell 3000 companies — an index that covers 98% of the investible U.S. market — and continue tracking firms even after they go defunct. This reduces survivorship bias and gives us a more accurate picture of what a strategy would have done without any benefit of hindsight. We’ll use prices from 2018-2023, a five-year period that should give us enough data.
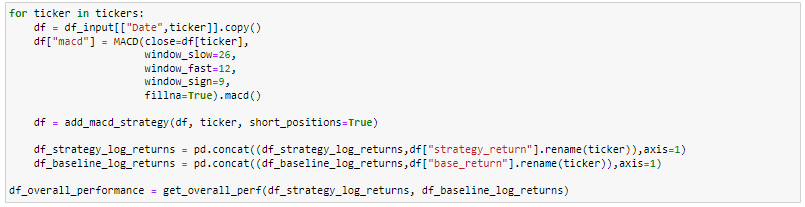
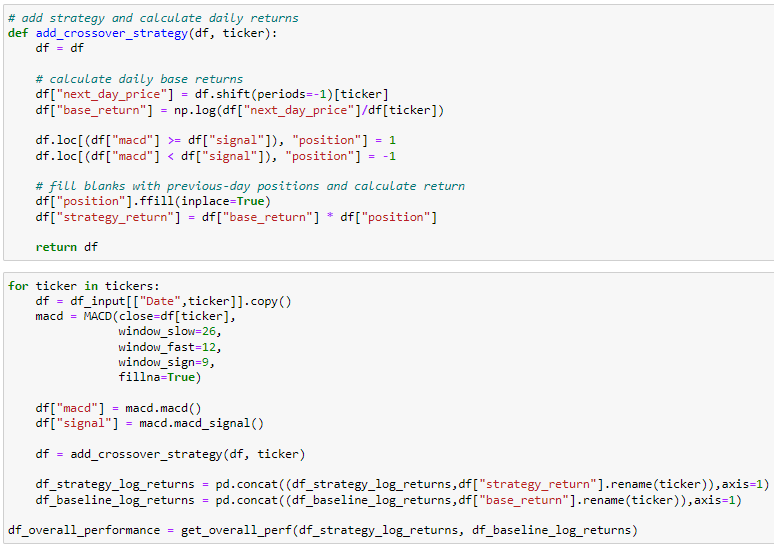
To begin, I’ll switch our MACD calculation to Python’s Technical Analysis (TA) system, a plugin that will help streamline our code. Here, we compress our previous multi-line function into a single command and then put it in a loop to test every ticker in our dataset. (You can see how these plug-ins can simplify code so much!)
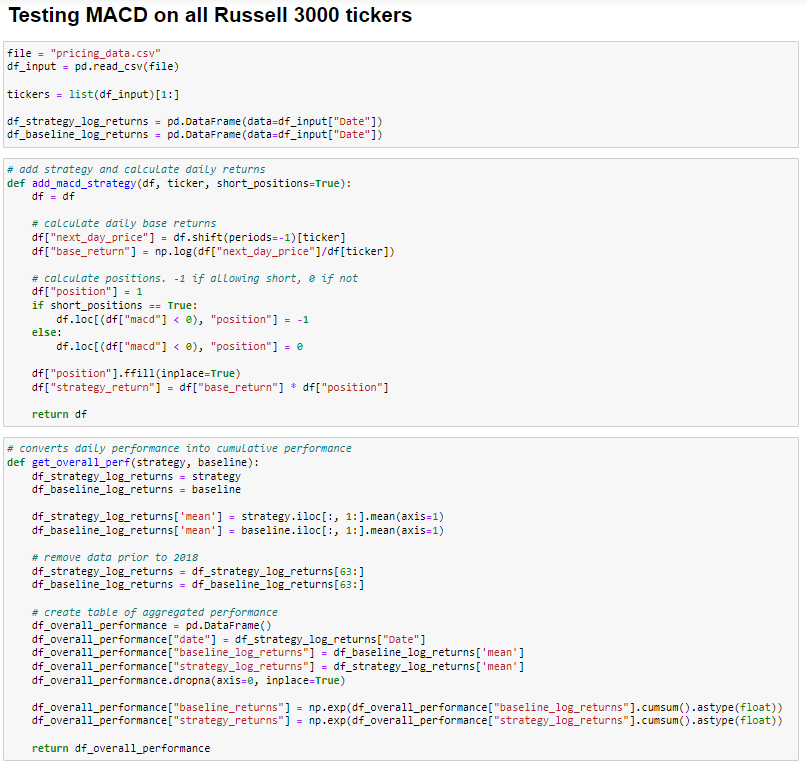
Next, we’ll add helper functions to inform the system when to “buy” and “sell” each stock. Whenever the MACD crosses over 0, our simple algorithm puts a “1” in the position column. And when it crosses below zero, we put in a “-1.” A second helper function combines the results into a single, averaged portfolio that we can analyze for risk and return. We’ll assume equal-weighted portfolios. Our data set also includes pricing data from late 2017 to create a “warmup period” for the MACD, which is later removed by our helper function before any analysis happens.
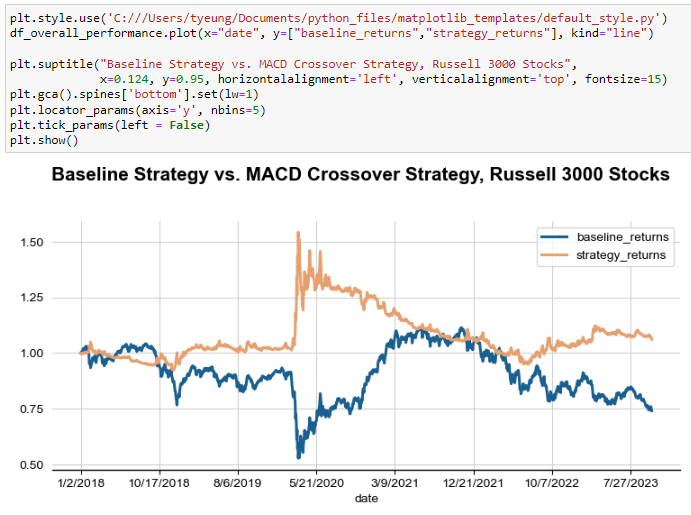
Finally, we plot our strategy’s performance over time and compare it to a baseline buy-and-hold strategy. The results are not particularly compelling, as we might expect.
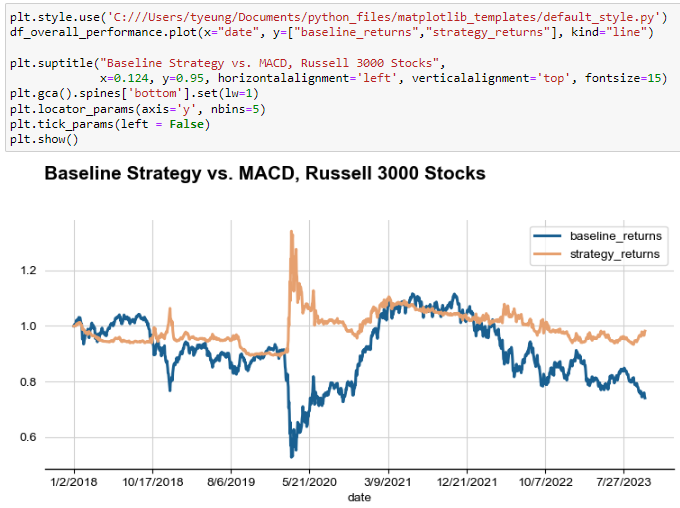
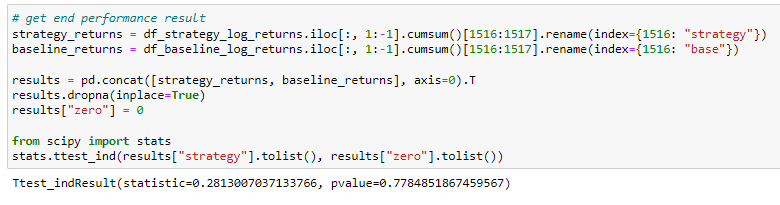
The final return of 2.05% over the period is virtually indistinguishable from zero, as a t-test quickly shows. According to statistical analysis, we should be roughly 78% sure that our final performance is totally random. In other words, the MACD strategy applied indiscriminately does not work.
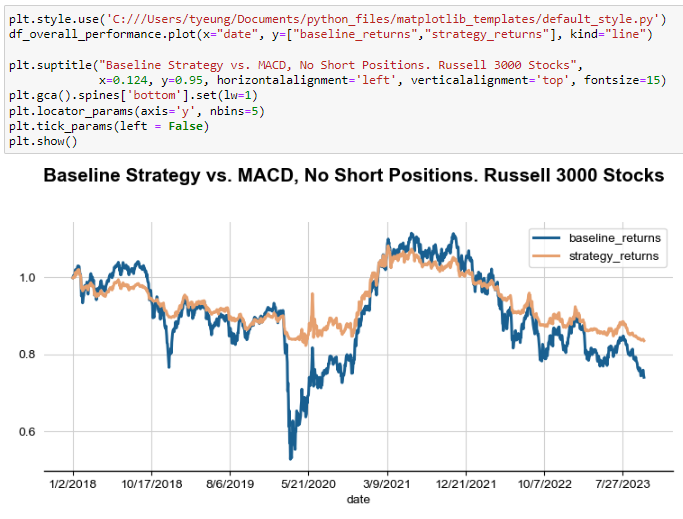
Disallowing short positions is no better, as we might expect with a non-working long-short strategy. Here is the same graph when we set short positions to “0” instead of “-1.”
2. Does The MACD Crossover Strategy Work?
The MACD crossover strategy fares slightly better, though not by much. Here, we edit the code to add a new “signal” column and use it in our new helper function. Our positions are “1” whenever the MACD is greater or equal to the signal value and “-1” otherwise. (We can also calculate crossover points by comparing previous-day values, but it’s the same result with more lines of code).
Our result looks like this:
Our total return improves from 2.05% to 6.13%, but a t-test shows that the results are still insignificant at the 95% level. Put another way, there’s a 16% probability that the results were down to luck — a level that statisticians will call “not good enough.”
3. Does the MACD Difference Strategy Work?
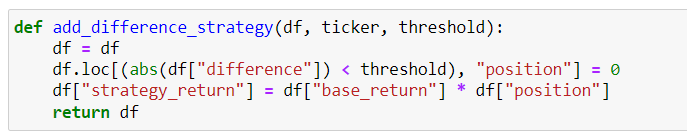
Our final basic test involves moving to a neutral position whenever the MACD difference becomes too small. To do this, we’ll first add a function that reduces our position to zero whenever the absolute difference between MACD and Signal line drops below a variable we’ll call “threshold.” And here’s what it looks like when we set our threshold to 0.1:
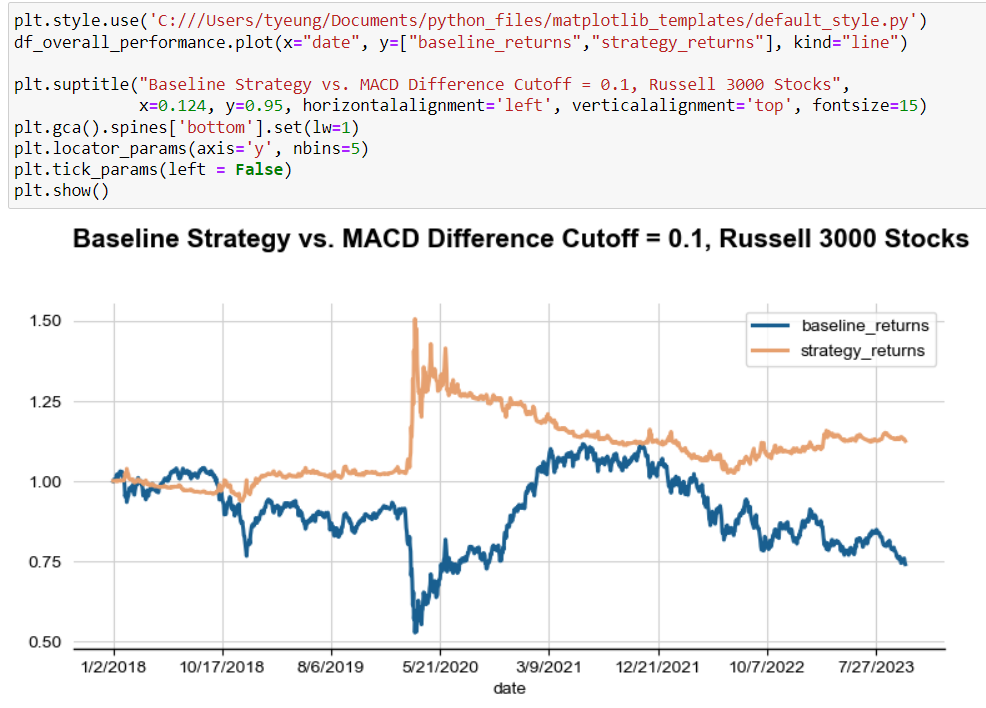
Immediately, we see some improvement. By moving our positions to zero whenever the difference function falls below 0.1, we improve our 5-year return from 6.1% to 12.7% — more than twice as good!
But a 12.7% return divided across five years is only a 2.4% annualized return. An investor could have done far better buying a market-weighted ETF of the index. Our testing system also ignores any trading costs and slippage, which would have further pulled down our returns.
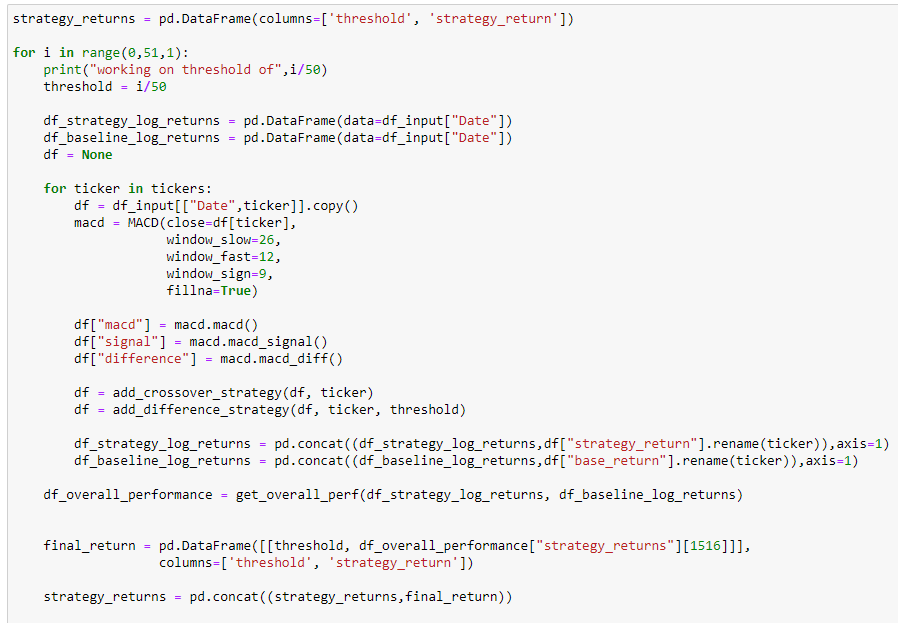
That means we’re probably using the wrong cutoff point. To fix that, here’s the same test run across different threshold numbers between 0 and 1. Performance peaks at around 21% at the 0.01-0.02 level before declining to 0%. Some basic statistical analysis (not shown here) now tells us that the results are significant and can’t be explained by luck alone. That means an investor following the MACD difference strategy who stopped trading when the difference fell below 0.02 would begin seeing significant outperformance.
Making the MACD Indicator Outperform
History also tells us that technical (price-only) indicators can be improved by adding some fundamental knowledge as well. It’s why firms like Goldman Sachs pay millions to computer science engineers with finance backgrounds; you need both skill sets to succeed.
When it comes to the MACD indicator, some straightforward math will quickly reveal that we’re dealing with a “breakout” strategy that rewards price increases with “buy” signals and punishes declines with “sells.” That puts it in the same category as strategies like Bollinger Bands, and in the opposite camp of “mean-reversion” strategies like RSI. You can prove this mathematically or look at the diagrams in the sections above.
In other words, the MACD strategy should work better for high-momentum firms where initial success generally leads to even more significant gains. Innovative startups like Tesla (NASDAQ:TSLA) and Amazon (NASDAQ:AMZN) fall into this camp. An initial surge in share prices allowed these enterprises to issue more stock at high valuations. That helped fund more growth and created a self-fulfilling path to success. Failing companies are also considered high-momentum, since bankruptcy fears can drive suppliers and banks away… causing the very bankruptcy the parties initially feared. The MACD strategy would probably do a fine job identifying these weak firms and urging investors to sell them short.
Meanwhile, the MACD strategy would be a terrible choice for mean-reverting stocks like Coca-Cola (NYSE:KO) or Procter & Gamble (NYSE:PG) where a dip is usually followed by a rise. When returns on capital are relatively stable, stock prices will remain range-bound. (I have an article on that relationship for those interested in learning more). That means using the MACD strategy on these stocks will cause traders to buy high and sell low — the total opposite of what you want to do.
That’s why running the MACD strategy on ALL Russell 3000 stocks often generates disappointing results. When you mix high-momentum and mean-reverting stocks into the same strategy, you end up with an average pile of grey.
1. Breakout Stocks
To fix this issue, consider what happens when you run the MACD strategy on only breakout stocks. Here, I’ll define them as:
- No Dividends. Breakout firms tend to pay no dividends to conserve cash. Amazon, for instance, still pays no dividends since it can reinvest its earnings for greater returns.
- Positive Stock Issuance. The company issued stock in the prior year. Much like paying zero dividends, this is typical for companies that are rising fast
- Strong Growth. Analysts expected the firm to increase sales by 20% or more the following year.
These screens filter out mean-reverting stocks and focus on the companies where initial wins generally translate into future gains.
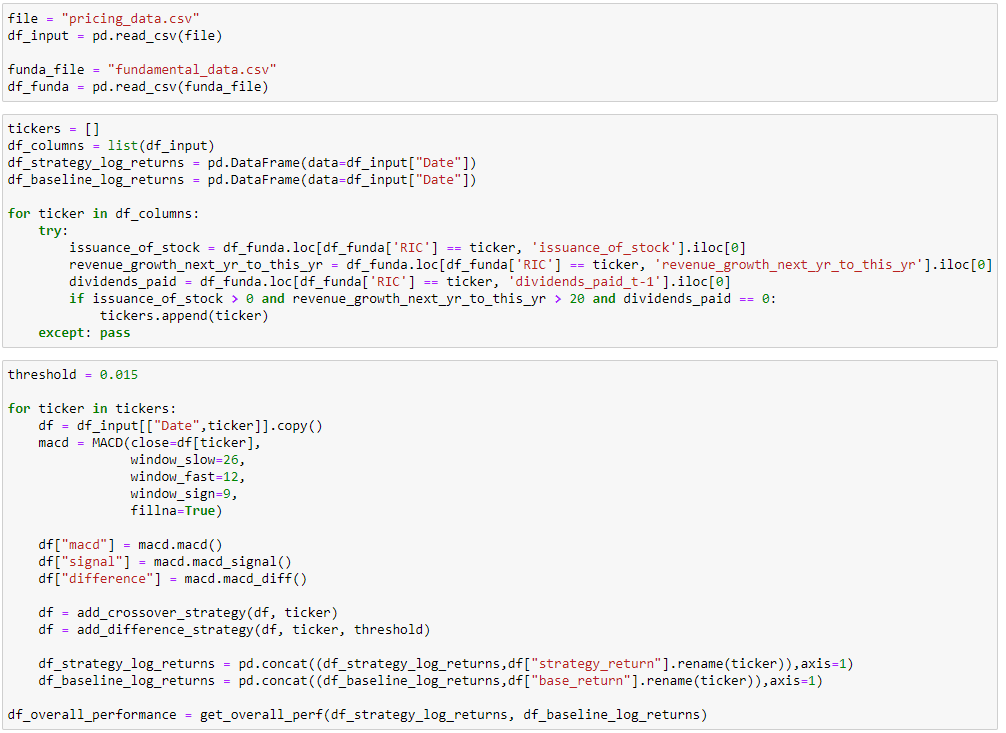
To make this happen, our code pulls in an additional file called “fundamental_data.csv” that contains data about our entire stock universe. We then rebuild our ticker list with the new constraints. Note that these names are not rebalanced since we want to know how the MACD strategy will react to companies that drop out of the index or go bankrupt.
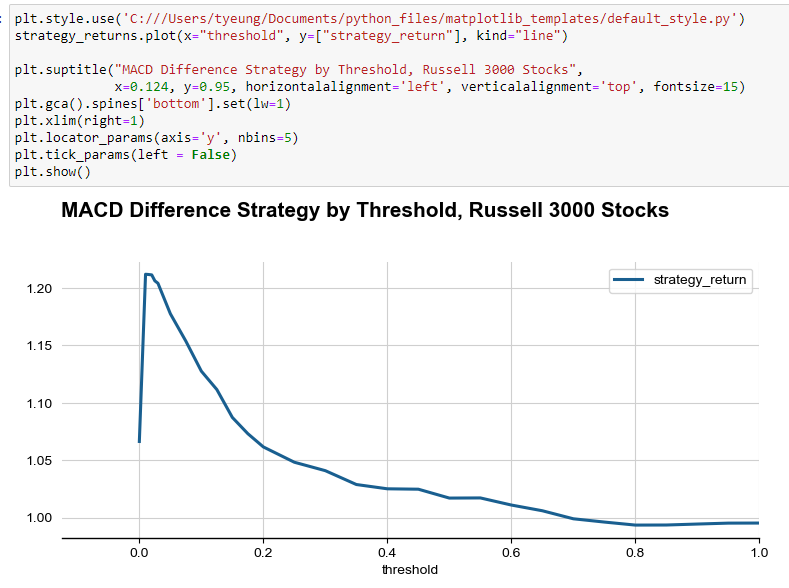
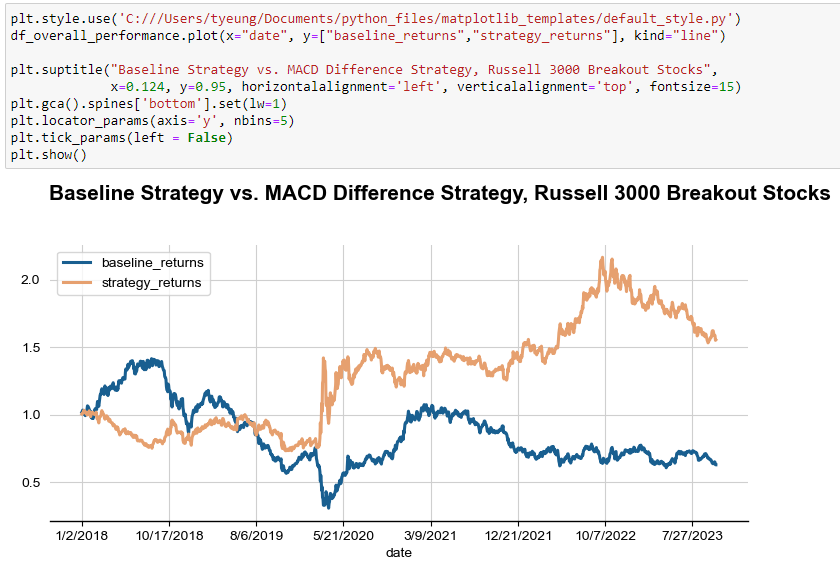
The results look excellent. Here, our performance surges to 55.4%, while the baseline buy-and-hold strategy sinks to -37.2%. That 92.6% difference comes to an annual 14% outperformance — an incredible amount that anyone should be pleased with! For comparison, outperforming the S&P 500 between 2018-2023 by that amount would have turned a $10,000 investment into $35,000, compared to a $16,800 buy-and-hold return.
2. Mean-Reverting Stocks
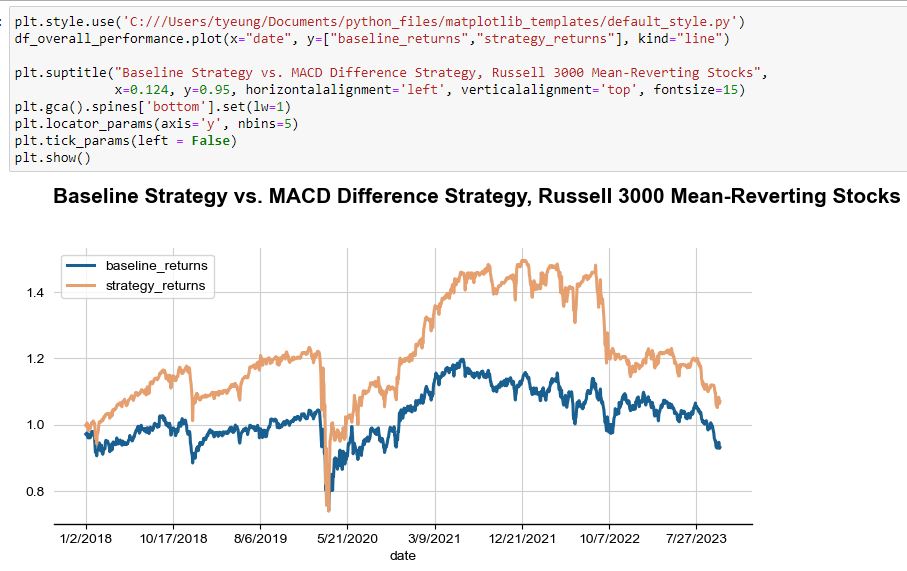
Next, look at companies that trade in narrow ranges where a reverse MACD strategy should perform well. Investors will buy whenever the MACD Difference strategy says to sell, and sell whenever it signals a buy. Running this in reverse should help the strategy perform well where it otherwise wouldn’t.
Let’s test this “opposite-day” strategy on all consumer non-cyclical and utility stocks. These companies usually have range-bound profits, where a decline in earnings is usually followed by a recovery. Many water and electric utilities have regulatory requirements to set metering rates that target a particular return on equity (ROE) level.
Again, we see significant improvements, with returns reaching as high as 50%. However, the reverse MACD system could not cope with the selloff in 2022 when declining counter-cyclical stocks kept going down. That’s the risk of using a technical strategy without considering the broader macroeconomic picture.
Putting It All Together: The Enhanced MACD Strategy
To be sure we don’t fall into this macroeconomic trap, our final step is to see what happens when we combine different trading strategies together. If two strategies outperform the market, surely their united powers can do even better!
Let’s try combining the MACD Difference strategy with two other proven winners:
- RSI. The Relative Strength Index is a mean-reverting strategy that excels at finding buy-the-dip stocks. We’ll use the reverse RSI strategy to complement MACD.
- Bollinger Bands. These lagging indicators help identify turnarounds in momentum.
We’ll use our same “breakout stock” universe from before: zero-dividend stocks that have raised capital with greater-than-20% expected growth rates. We then add the following rules:
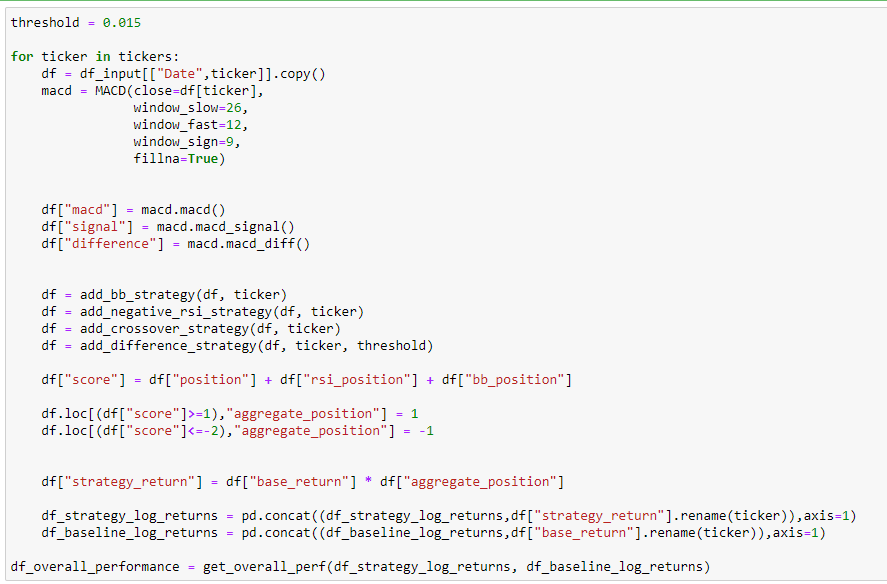
- Scoring. Each strategy gets a score of “1”, “0” and “-1” to represent buys, sells and short sells.
- Combination. The scores of the three are added together to create a combined score.
- Strategy. If a company receives a score of “1” or higher, the stock is bought for that day. If a company scores “-2” or lower, the stock is sold short. “-1” and “0” scores are considered neutral positions.
For example, if a company like Amazon scores a “1” with both RSI and MACD, and a “0” with Bollinger Bands, the combined score is 2 (since 1+1+0 = 2), making Amazon a buy. Conversely, if Amazon scores a “-1” with all three strategies, its combined score is -3 and the stock is sold short.
This combined strategy creates a voting system that favors long positions, reflecting the fact that most investors buy stocks, and not short them.
The results are so good that our graphing scale changes!
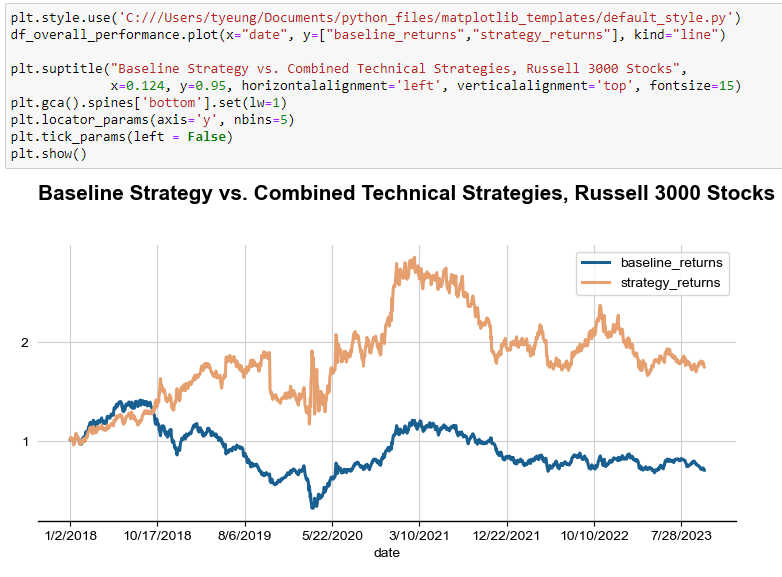
Our final results show a 74.8% increase in value since 2018, a 103.8% outperformance over a buy-and-hold strategy. This is also done without taking on excess leverage and represents an annual 15.3% outperformance.
Closing Thoughts: How to Beat the Market
If this seems like a lot of information, don’t worry. Beating the stock market is surprisingly straightforward if you consistently use the right, proven strategies.
The technical strategies you read above form the basis of Technical Trader, one of the three pillars of my MarketMaster stock trading system. The other two pillars involve much more fundamental analysis, which is a provenly better long-term investing method. And if you want to learn more, follow me here at InvestorPlace.com, where I’ll soon be launching the integrated system.
On the date of publication, Thomas Yeung did not have (either directly or indirectly) any positions in the securities mentioned in this article. The opinions expressed in this article are those of the writer, subject to the InvestorPlace.com Publishing Guidelines.