The stock market has been relatively quiet for the past two months, with a sideways trend within a tight range for the S&P 500 and other major U.S. indices.

That may be about to change, with two key events — the June 14-15 FOMC meeting and the June 23 “Brexit” vote — on tap for the month ahead. For traders looking to position themselves for heightened volatility, seven stocks currently stand out for the potential to deliver outsized returns due to their technical formations.
Of these, four — CME Group Inc. (CME), Dow Chemical Co. (DOW) Laboratory Corp. of America Holdings (LH), and Potash Corp. of Saskatchewan Inc. (POT) — offer above-average upside; while three — Alphabet Inc. (GOOGL), Delta Air Lines Inc. (DAL) and Cardinal Health (CAH) — may provide ways to pick up some beta in a sell-off.
Stock Charts to Watch: CME Group Inc. (CME)

The exchange operator CME Group Inc. has one of the most interesting charts in the market right now. The stock has met resistance near $100 on three separate occasions in the past two years, and it’s closing in on this key resistance line once again following its rally of the past month.
A break above $100 could bring meaningful upside for CME, since the stock hasn’t traded above this level since 2008.
CME stock has typically topped out after hitting 30x trailing earnings in the past three years, and it’s currently at 25.6 times. This implies the potential for the shares move as high as $114, versus Monday’s close of $96.63.
Watch InterContinental Exchange Inc. (ICE), which is also trading right at resistance, for a signal regarding the likelihood of a breakout in CME.
Stock Charts to Watch: Alphabet Inc (GOOG, GOOGL)

After delivering outstanding returns in 2015, Alphabet has traded sideways so far this year. In so doing, it has established support at $700 — the same level that served as resistance in mid-2015. A sustained break below $700 will likely signal that the party’s over for this former market leader and key member of the “FANG” cohort.
While the stock has some distance to its support line from Monday’s close near $717, it is also struggling to stay above its 200-day moving average. Watch Alphabet’s behavior around its MA — if it fails to hold this level, a drop below the $700 line may be the next step for the stock.
At the same time, its sideways price action also has created a resistance line at $800. A breakout is unlikely in the immediate future, but this may prove to be an important level to monitor as the year progresses.
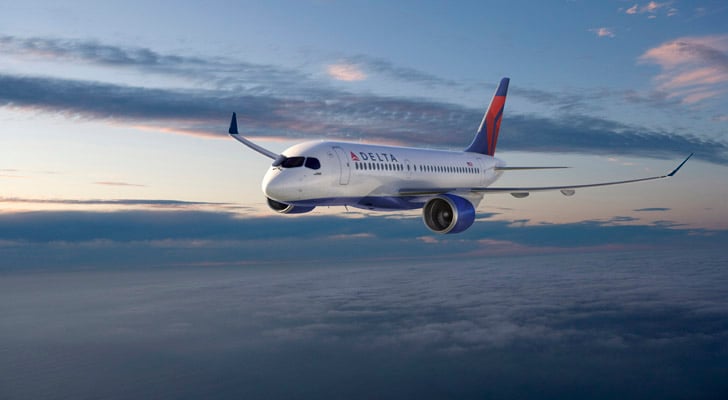
Stock Charts to Watch: Delta Air Lines Inc. (DAL)

The $40 level has been a key pivot point for Delta, acting as resistance in 2014 and serving as support since then. After surging above $50 in late 2015, Delta has trended lower so far this year amid the rally in crude oil.
Now, at just under $43 as of Monday’s close, the stock is back in range of its support. Although DAL shares have rallied in the past week, its proximity to support bears is close given that the stock has made a series of lower highs, its 50-day moving average is trading under the 200 and the 200 appears to have rolled over.
In addition, earnings estimates have fallen steadily over the past 90 days. Bearish traders should keep an eye on Delta as a way to pick up some beta if the broader market experiences its typical summer volatility.
Stock Charts to Watch: Dow Chemical Co. (DOW)

Dow Chemical Co. is nearing the $54-55 range, which has acted as resistance multiple times in the past two years, as well as in 2004. The stock briefly broke out above this long-standing resistance in December, trading as high as $57.10 before falling back a day later. Now, at Monday’s close of $52.26, Dow shares are once again approaching this important pivot point.
The potential for a more extended breakout remains in place, as Dow shares are trading near the low end of their valuation range of the past three years even as its earnings estimates are rising.
The Dow is also fairly volatile with a beta of 1.3, meaning that it may offer bullish traders a compelling way to play for upside in the broader market.
Stock Charts to Watch: Cardinal Health Inc. (CAH)

Shares of Cardinal Health Inc. have been under the gun this year, falling more than 13.6% through Monday, and the pain could be set to continue. At $77.74, CAH stock is trading close to the $75 support line that has acted as resistance four different times in the past year.
The overall chart is bearish, with a series of lower highs and a 200-day moving average that has been trending lower for four months. With that said, CAH has staged meaningful rallies every time it has held this level, with two sustained moves of over 15%. The best bet: traders should put Cardinal on their watch lists and be ready to position for another sizable move if the stock trades back toward support at $75.
Stock Charts to Watch: Laboratory Corp. of America Holdings (LH)

At Monday’s close of $126.60, Laboratory Corp. of America Holdings is trading close to its 52-week high ($128.84) and its all-time intraday peak above $130 established last summer.
The clinical lab-testing company has exhibited robust price momentum, with a gain north of 25% from its February low established during amid the sell-off in the broader health care sector.
Although Lab Corp. has already come a long way, its chart indicates a strong possibility of additional short-term upside if the rally in health care continues.
Stock Charts to Watch: Potash Corp. of Saskatchewan Inc. (POT)

Shares of this Canadian fertilizer producer have been hammered in the past year, and — unlike other commodity-related names — the stock hasn’t experienced a recovery. What it has done, however, is build a base at $15 that provides traders with a chance to define their downside risk and position for a potential rally off of an extended base.
Although a similar move in POT is unlikely, the positive price action in VanEck Vectors Gold Miners ETF (GDX) offers a clue of what could be in store for POT if its fundamentals can gain even minimal traction. This is a high-risk play, but traders need to have POT on their watch lists to prepare for a rally and an eventual break above the 200-day moving average.
The fertilizer company CF Industries (CF) is also sitting right at support, and its behavior around its current level will provide a important signal regarding POT.
As of this writing, Daniel Putnam did not hold a position in any of the aforementioned securities.