A back and forth session on Thursday ultimately ended in a stalemate, with the S&P 500 closing a scant 0.04% lower yesterday. The direction of the market’s undertow, if there is one, remains unclear.

3M (NYSE:MMM) did more damage than any other name, falling nearly 13% after reporting disappointing first-quarter numbers and ultimately deciding to cull 2000 jobs to adjust for a poor outlook. Nokia (NYSE:NOK) wasn’t far behind with more than an 8% stumble though, after swinging to a surprising first-quarter loss.
There were some winners, though not as many, and no major names made meaningful gains. New Age Beverages (NASDAQ:NBEV) jumped more than 5% yesterday on news surrounding its new Marley-branded CBD drink, but NBEV shares gave back more than 2% in yesterday’s after-hours trading.
None of them are great trading prospects headed into the final trading day of the week though. Rather, it’s the stock charts of AbbVie (NYSE:ABBV), ConocoPhillips (NYSE:COP) and MGM Resorts International (NYSE:MGM
) that have earned closer looks.
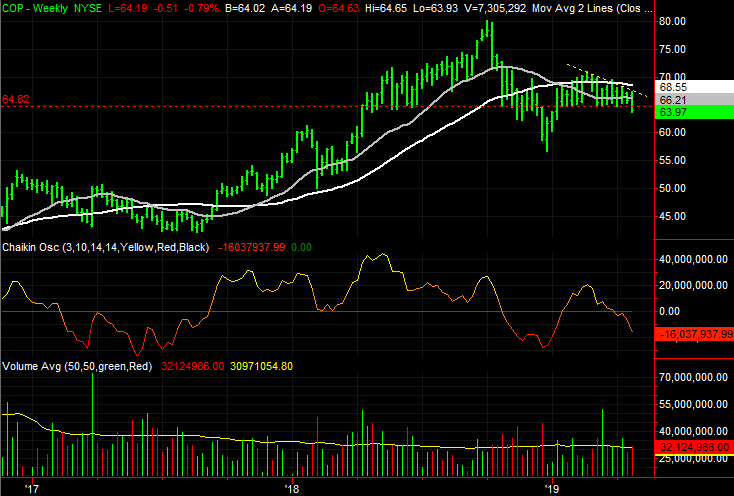
ConocoPhillips (COP)
Back on April 12, ConocoPhillips was put under the trading microscope as a potentially bearish candidate. A major floor was being tested, repeatedly, but more than that COP stock was logging more lower highs thanks to increasing resistance at key moving average lines. Most noteworthy of all was that ConocoPhillips was being left out of a rally most other energy names were enjoying.
As of Wednesday, that support line has been snapped. As of Thursday, the bears put some distance between that floor and COP stock.
Click to Enlarge
- The big line in the sand is right at $65, plotted with a red dashed line on both stock charts. Although shares had been lower since that floor was defined, that’s the low that has been found the most since the middle of last year.
- Bolstering the bearish tide is the volume behind it. The weekly chart’s Chaikin line has already crossed below zero, which tends to be a good signal of a sizeable pullback.
- It’s subtle, to the point of being mostly overlooked. But, as of Thursday’s action, all four key moving average lines are sloped downward, pointing to the depth of the bearish momentum now in place.
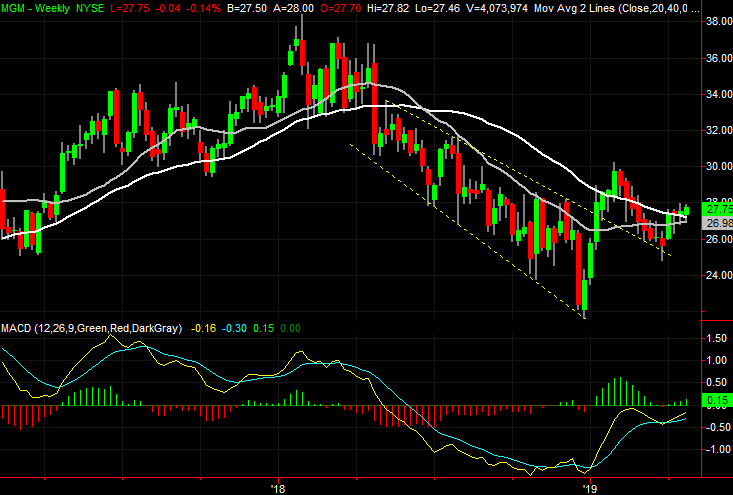
MGM Resorts International (MGM)
In January, MGM Resorts popped out of a well-defined downtrend. Although the effort continued to get traction for a few more days, that move was ultimately unwound — and then some — in February and March.
The bulls appear to have regrouped since then, pushing the stock back above all the key moving average lines. It’s this second effort, in fact, that largely seals the deal on the bigger rebound effort. The key is the interplay of those moving averages.
Click to Enlarge
- This week’s triggering event is the move back above the 200-day moving average line, plotted in white on both stock charts.
- Also, take note of the way the moving average lines are starting to converge again after a big bearish divergence last year. The impending bullish crosses of those moving average lines are buying triggers in and of themselves.
- The clincher for the budding rebound effort would be a break above $27.96, plotted with a red dashed line on the daily chart. That’s where MGM has peaked a couple of times since last week.
- Although compelling, the budding renewal of the breakout so far lacks volume. If the volume is still light after any move above $28, close caution remains advised.
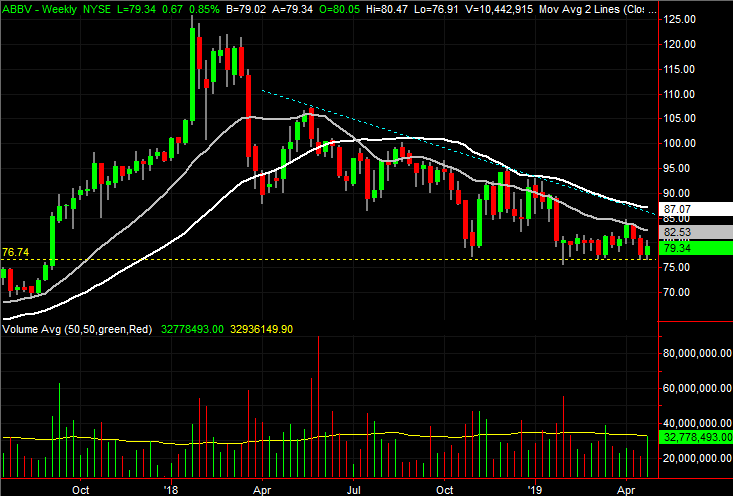
AbbVie (ABBV)
With just a quick glance, AbbVie looks like it’s in serious trouble. Shares have been trending steadily lower since April, and are within easy reach of new 52-week lows … again.
ABBV stock may be better positioned for a rebound than it seems on the surface, however. While there’s still some significant work that needs to be done to snap AbbVie out of its bearish rut, a great deal of the needed hard work has already been done.
Click to Enlarge
- The game-changer here is the horizontal support that has developed around $77 over the course of the past few months. That floor is plotted with a yellow dashed line on both stock charts.
- Curiously, although it has not helped make much forward progress, the past three days have not only been bullish, they’ve been on above-average volume. The bulls may be testing the waters.
- From here, ABBV will need to hurdle the falling resistance line that tags all the key highs going back to May of last year. That line is plotted in light blue on both stock charts, and currently rests at $85.60.
As of this writing, James Brumley did not hold a position in any of the aforementioned securities. You can learn more about James at his site, jamesbrumley.com, or follow him on Twitter, at @jbrumley.