That’s four big daily wins in a row for stocks, with the S&P 500’s gain of 1.05% on Friday. It’s still too soon to call it the beginning of a recovery move; it’s almost too much, too fast. But, it buys time for the bulls to regroup.

Microsoft (NASDAQ:MSFT) carried more than its fair share of the weight, rallying 2.8% to cross back above the $1 trillion market cap mark. Weighing the market down was the 1.26% tumble from Bank of America (NYSE:BAC), setting the tone that adversely impacted most other banking names. Concerns of interest rate cuts rattled bank investors, as lower interest rates threaten bank profits.
Neither are especially compelling trading prospects headed into this week’s trading action though. Rather, take a look at stock charts of McKesson (NYSE:MCK), Coca-Cola (NYSE:KO) and CenterPoint Energy (NYSE:CNP). Here’s why, and what needs to happen next.
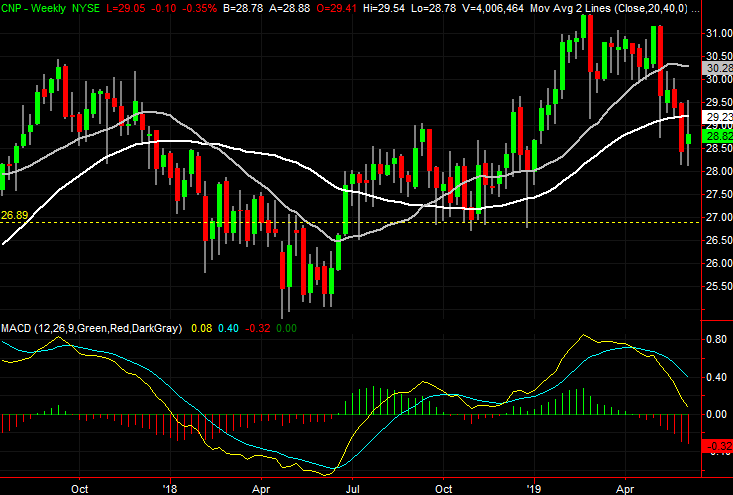
CenterPoint Energy (CNP)
When we last looked at CenterPoint Energy back on May 15, it had just pushed up and off of its 200-day moving average line, only to run into resistance again. While it could have gone either way at the time, the bears actually had the edge.
Since then, the 200-day line failed to keep the stock propped up. Sure, CNP snapped back in early June to cross back above the very same 200-day moving average line. With the shape and placement of Friday’s bar, however, it appears CenterPoint shares are back en route to even lower lows.
Click to Enlarge
- The red flag is Friday’s engulfing pattern, meaning the high open and low close completely engulfed Thursday’s low/high range. Such a sweeping change of heart is telling.
- Simultaneously, the big bearish swing also dragged CNP back below the pivotal 200-day line, plotted in white on both stock charts.
- If the selling gets traction, the next likely landing spot is just under $27, where CNP found support for the better part of last year.
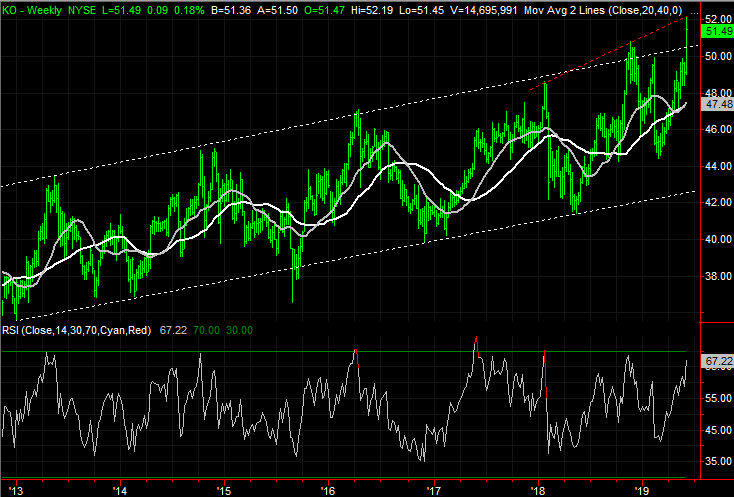
Coca-Cola (KO)
With nothing more than a quick glance, Coca-Cola looks enticing. Shares have been rallying quite well since February’s low, seemingly unstoppable. The fact that a long-term resistance line, plotted in white on the weekly chart, was hurdled last week only bolsters the bullish argument.
A closer, more thorough look at the weekly chart, however, reveals the advance just bumped into another rather well-established ceiling. Meanwhile, the shape of Friday’s bar also suggests we’re ready to pivot back into a pullback.
Click to Enlarge
- Friday’s high aligns with the prior two major peaks from KO stock, plotted in red on the weekly chart that’s also on the verge of an overbought RSI indicator.
- In the daily timeframe, the open and close both near the low of a relatively tall bar, which also suggests a move from a net-buying to a net-selling environment.
- While the stage is set, the move won’t be complete until we get a confirmation in the form of a lower close.
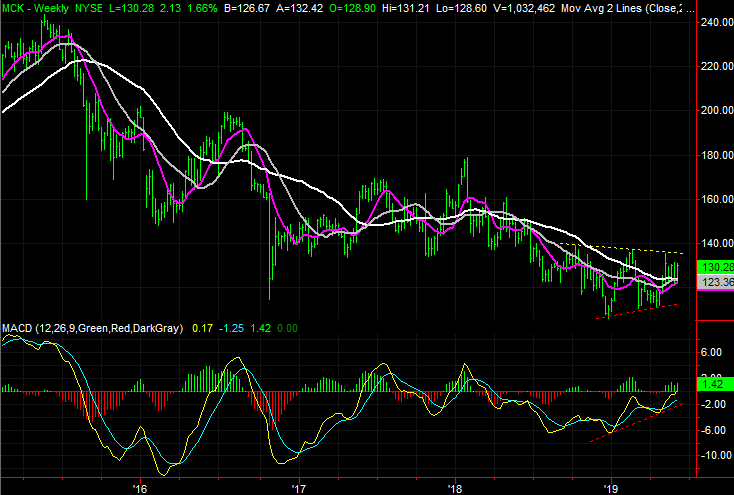
McKesson (MCK)
Finally, given its multi-year history, doubting McKesson is on the mend now wouldn’t be a tough conclusion to make. And, that may well be the case here despite a couple of bullish curiosities. Nevertheless, those curiosities are worth pointing out, as a recovery effort from here could lead into a major rally effort.
Click to Enlarge
- Most noteworthy is also the least noticed … not only are we now seeing a bullish MACD convergence, the most recent MACD crossover took place above the prior one. It points to a longer-term advance that needs multiple efforts to get going.
- At the same time, notice on the daily chart that all the key moving average lines are about to converge after last year’s divergence. The big clue to watch for is the purple 50-day average crossing above the white 200-day line. That’s a “golden cross” that suggests more bullishness ahead.
- The ultimate ceiling, however, is currently at $135. That’s the line that connects all the major peaks since September, marked in yellow on both stock charts.
As of this writing, James Brumley did not hold a position in any of the aforementioned securities. You can learn more about James at his site, jamesbrumley.com, or follow him on Twitter, at @jbrumley.