After teasing investors with a taste of a recovery, stocks slumped on the second trading day of the year. Led lower by Apple (NASDAQ:AAPL), which fell 10% on Thursday after issuing a rare revenue warning for its recently-completed quarter, the S&P 500 logged a 2.48% loss yesterday. The volume behind the selloff wasn’t exactly light either.
Apple had help, to be clear. Advanced Micro Devices (NASDAQ:AMD) tumbled to the tune of 9.5%, and rival/peer Nvidia (NASDAQ:NVDA) wasn’t far behind with a 6% setback mostly in response to an impending class action lawsuit being prepared to levy against the latter company. Some investors feel Nvidia didn’t fully disclose the full potential of a collapse of the cryptocurrency mining market.
It’s a weak legal argument, but an alarming headline all the same.
There were winners, though few and far between. Celgene (NASDAQ:CELG) popped nearly 21% after Bristol-Myers Squibb (NYSE:BMY) made a $74 billion bid for the biopharma name. Buyout offers can’t inspire long-lasting bullishness for other names though, particularly in the midst of a strong selloff that leaves the market within sight of bear market territory.
The market environment makes trading tricky for the foreseeable future, but the stock charts of Schlumberger Limited (NYSE:SLB), Abbott Laboratories (NYSE:ABT) and Incyte Corporation (NASDAQ:INCY) look positioned to do their own thing regardless of what the broad market does from here.
Abbott Laboratories (ABT)

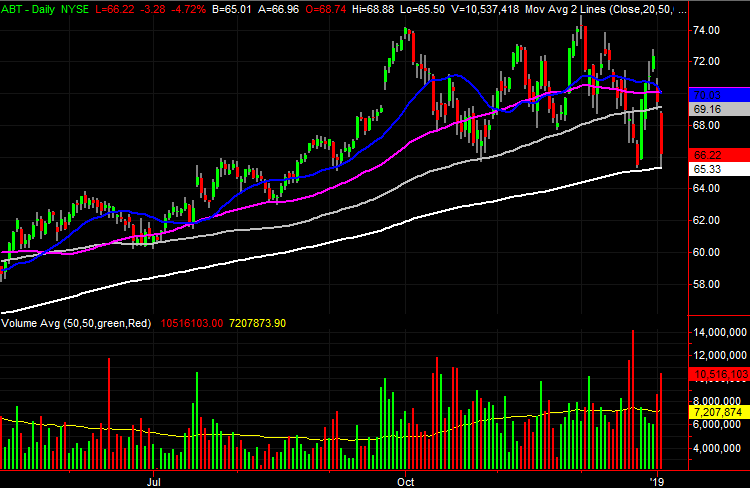
With nothing more than a quick glance at Abbott Laboratories, the last few days just look like the same volatility other stocks have faced of last. That’s not the case, however. Zooming out to a weekly chart of ABT, the recent wild swings are different, and telling.
Perhaps worse, Abbott is back to a critical make-or-break line in the sand. One more bad day could push it over the edge.

Click to Enlarge
• At the same time, notice that the bearish days have been on higher volume than the recent bullish days. The weekly chart’s Chaikin line moved back below zero three weeks ago.
• Notice the height of the weekly bars since November. Consistently taller bars suggests more wrangling between the bulls and the bears, which is a new development for Abbott shares.
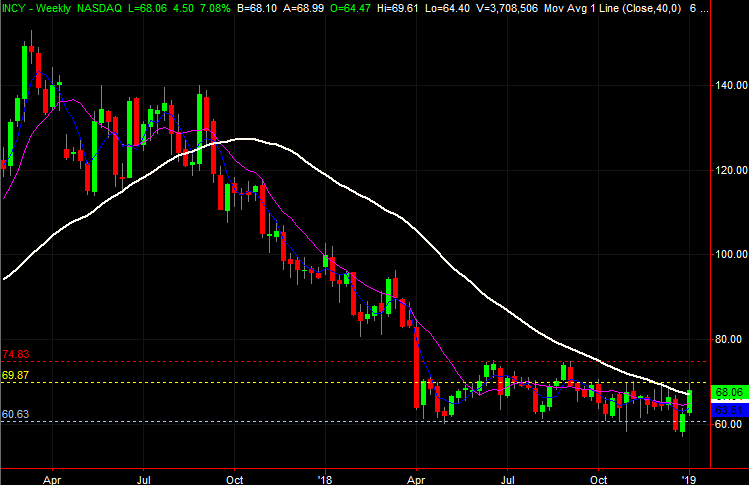
Incyte (INCY)
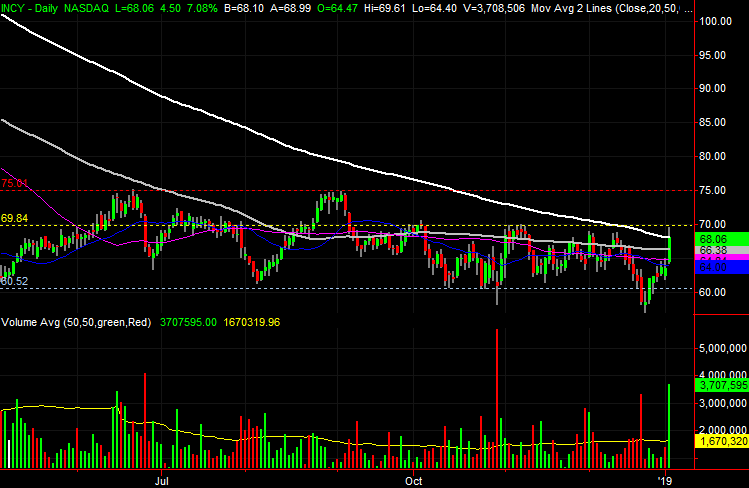
Three weeks ago, after spending several months in a consolidation range, it looked like Incyte was finally about to fall out of that range … to the downside. At the last possible point before sliding into a freefall, though, the buyers started to push back.
It’s a good thing they did. Yesterday’s upgrade from Guggenheim Partners has pushed INCY back up to the upper side of that sideways trading range. Better yet, a little more progress will push INCY shares above a huge technical ceiling that could prove catalytic with just a little more traction above it.
Click to Enlarge
• Moving back into play is the 200-day moving average line, plotted in white on both stock charts. Incyte temporarily moved above that level yesterday, though wasn’t able to close above it.
• The more technical ceilings INCY clears, the better-developed the breakout effort will become. Moving above the final one around $75, plotted in red, could prove explosive after months of consolidation.
Schlumberger (SLB)
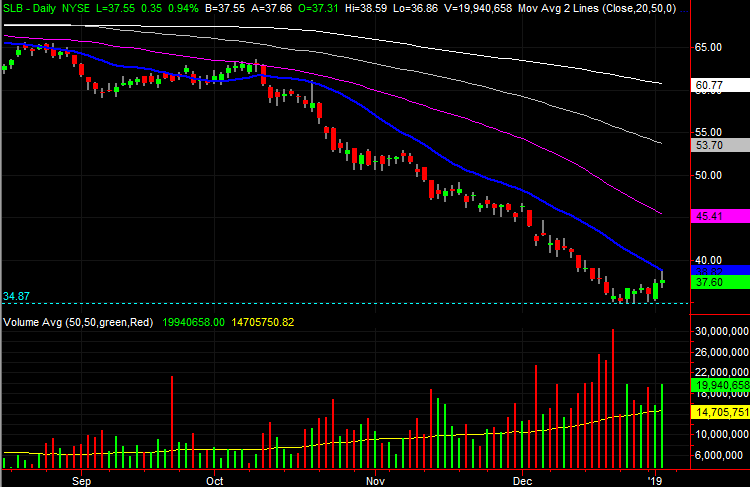
Last but not least, though it’s got more to do with an impending recovery of the entire energy market than with the company itself, Schlumberger is still one of the best-positioned stocks within the sector to drive a sizeable rebound move.
The first of its make-or-break lines was defined yesterday.

Click to Enlarge
• Though not yet decisively so, we’ve seen a little more bullish volume than bearish volume since Christmas, after a high-volume meltdown leading to December’s multiyear low.
• While Schlumberger is oversold and ripe for a rebound, it’s still tethered fairly strongly to the price of oil. This budding effort will need help from crude prices if it’s to last.
As of this writing, James Brumley did not hold a position in any of the aforementioned securities. You can follow him on Twitter, at @jbrumley.